Minority Responses in Persona-Prompted LLMs: Following Architect of Silence
The representation problem raised by Architect of Silence, followed by the design, findings, and limits of independent checks and exploratory follow-up experiments.
Architect of Silence, by Soomin Kim, Eun-Ji Paeng, and Seung-Sup Kim, asks whether giving an LLM personas constructed to represent South Korea's population also reproduces the distribution of minority identities and social suffering. Its findings challenge that assumption. Soomin Kim and Eun-Ji Paeng are co-first authors; Seung-Sup Kim is the corresponding author. Their affiliation is the Department of Environmental Health Sciences, Graduate School of Public Health, Seoul National University.[2]
This post is a research note on independent checks and follow-up exploration, starting from the study's presentation and publicly available inputs. It is not an official collaboration or coauthored project with the original researchers, a completed standalone original study, or a complete replication of their paper. The questions are whether minority responses persist across tasks and what can be learned from generated choices, stated probabilities, and returned token scores.
Summary
The original study compared responses from demographically constructed synthetic people with national surveys to ask whose lives are missing when these people stand in for human respondents. Across four models given Korean personas, no generated responses identified the persona as having registered-disability status, being gay/lesbian or bisexual, being transgender, or having been born abroad. Social suffering was underrepresented on many measures, while some experiences were overrepresented.[2]
In the independent checks, I separated generated responses from answer-token probabilities, population proportions stated by the model, and per-person probabilities stated by the model. Scarcity of minority responses persisted in reconstructed multi-turn conversations, but the points at which probabilities changed depended on the task, format, and model. In an exploratory analysis of registered disability, some age-related pattern remained in stated per-person probabilities after external calibration of the overall proportion. These observations are not a demonstration of an internal mechanism or validation of a population simulator.
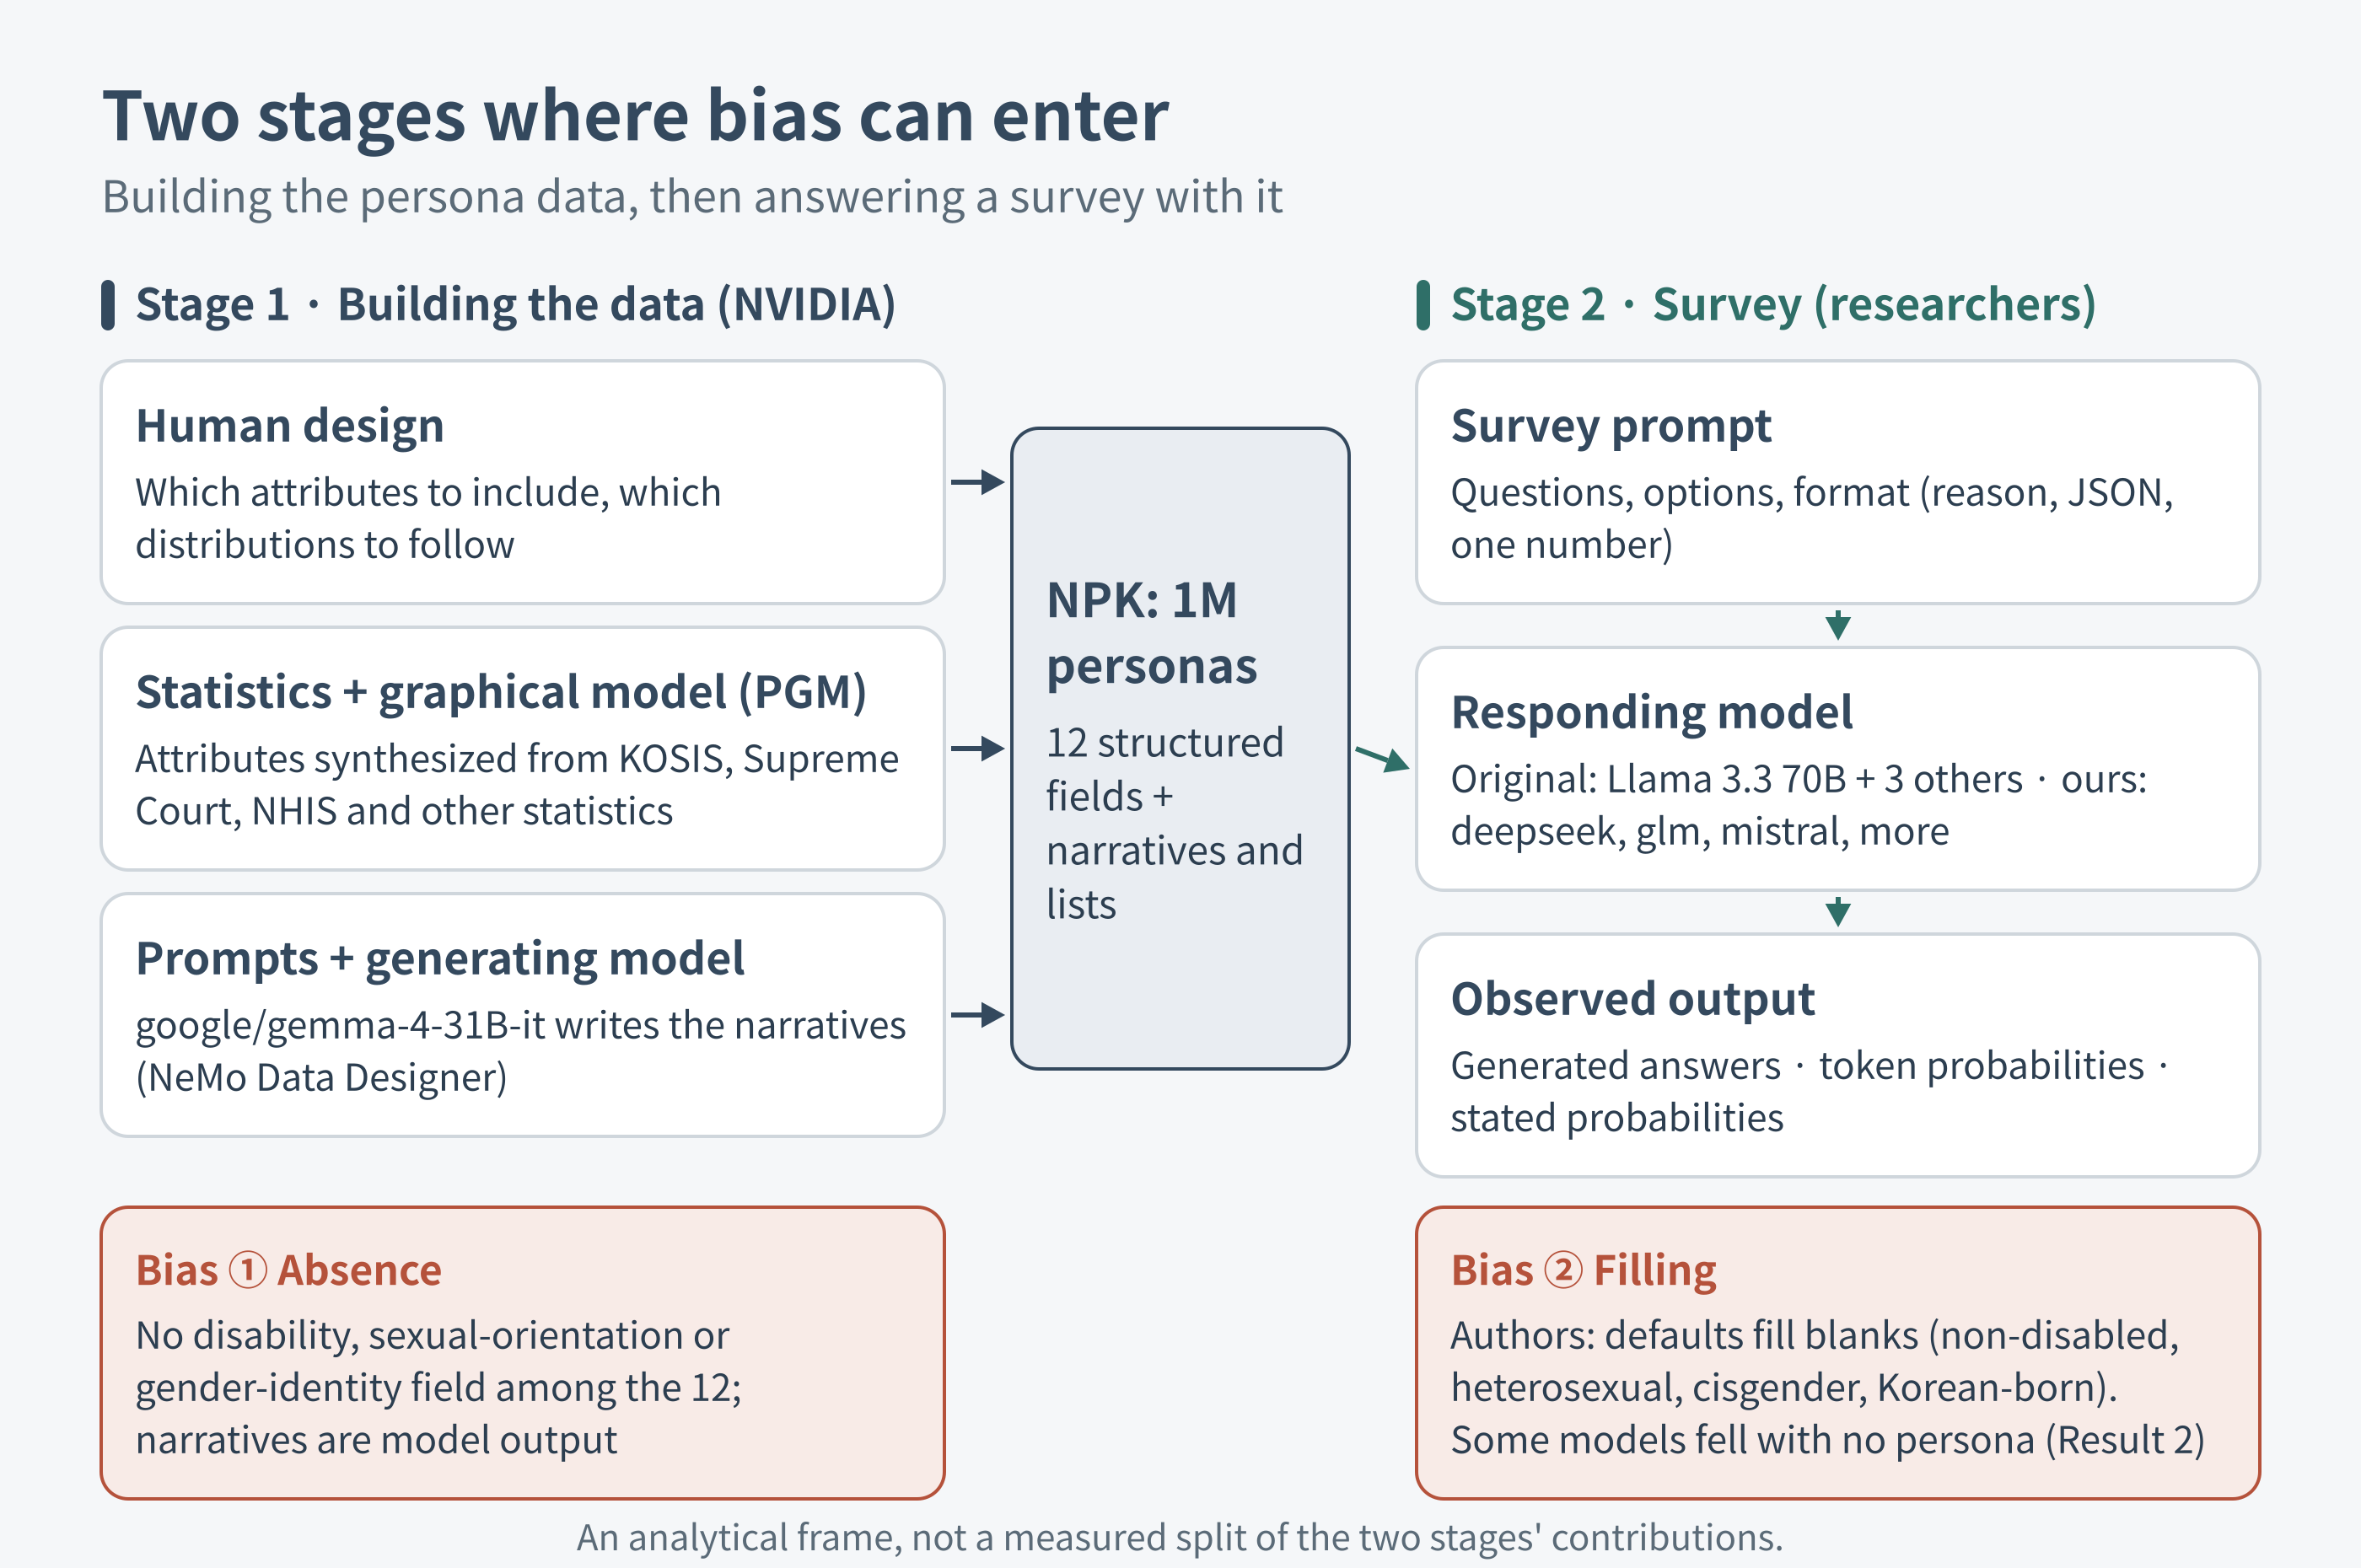
Figure 1. Two stages where bias can enter. The dataset card says NPK was synthesized from KOSIS and other official statistics using a proprietary probabilistic graphical model, google/gemma-4-31B-it, and NeMo Data Designer.[1] The division of roles in the diagram is my summary of that description. This generating model has the same model identifier as the Gemma 4 checked in Result 6. Markers ① and ② locate the absence and filling described by the original authors; this is an analytical frame, not a measured split of the two stages' contributions.
The original study: do matching demographics reproduce people's lives?
Background and research questions
Persona prompting gives a model information such as age, sex, occupation, family relationships, and a narrative about everyday life, then asks it to respond as that person. Collections of these virtual respondents are sometimes called silicon samples. Researchers use them to ask LLMs survey questions in place of people or to simulate social situations. The original study connects this practice to proposals for AI in health, welfare, and public policy, asking whose lives such proxy responses actually represent.[2, presentation pp. 4–6]
The input dataset was NVIDIA's Nemotron-Personas-Korea, or NPK.[1] It contains one million synthetic personas constructed to reflect South Korea's population distribution, with structured fields including sex, age, education, occupation, and place of residence, alongside life narratives. That claim of representativeness concerns the demographics incorporated into the inputs. It is not evidence that every identity and life experience is represented. The study examined the gap between a sample whose major demographic distributions resemble national surveys and the experiences its simulated respondents report.
The questions covered four domains:
- Minority identities: disability, gay/lesbian and bisexual identities, transgender status, and migration background.
- Childhood adversity: parental death or divorce, leaving education because of financial hardship, and being raised by relatives for economic reasons.
- Events and experiences in the past year: economic hardship, intimate-partner violence, and dissatisfaction with family relationships.
- Health and health behaviors: physical and mental health, suicide-related experiences, smoking and drinking, unmet healthcare needs, and related measures.
A “person” here is a synthetic record, not a survey participant. The question is therefore not whether a model can discover an individual's hidden identity. It is how the distribution of responses from a collection of synthetic people differs from the population it is intended to represent.
Design and comparison standards
The original study assigned 10,000 randomly sampled NPK personas to Llama 3.3 70B Instruct. A nested subsample of 1,000 was also assigned to each of GPT-6 Astra, Claude Opus 5, and Gemini 3.8 Flash. These are the original study's model names as recorded in the presentation, not the model set used in the independent checks below.[2, pp. 7–13]
Each model received 12 structured fields and narrative information and was instructed to respond as the persona. The study divided 31 questions into nine rounds. For each question, the model first wrote a reason in Korean and then selected a multiple-choice option. The verbatim responses from earlier rounds were carried forward in the conversation history. The presentation reports that all four models answered without refusing.
The comparison sources were the Population and Housing Census, Korea Welfare Panel Study (KOWEPS), Korea National Health and Nutrition Examination Survey (KNHANES), and Korea Health Panel Study (KHPS). Minority identities were compared with available population statistics. For sexual and gender minority items without nationally representative comparison statistics, the presentation reported model outputs alone. Because NPK targets Koreans, migration background was operationalized as being a Korean born abroad, rather than encompassing all foreign nationals living in South Korea.
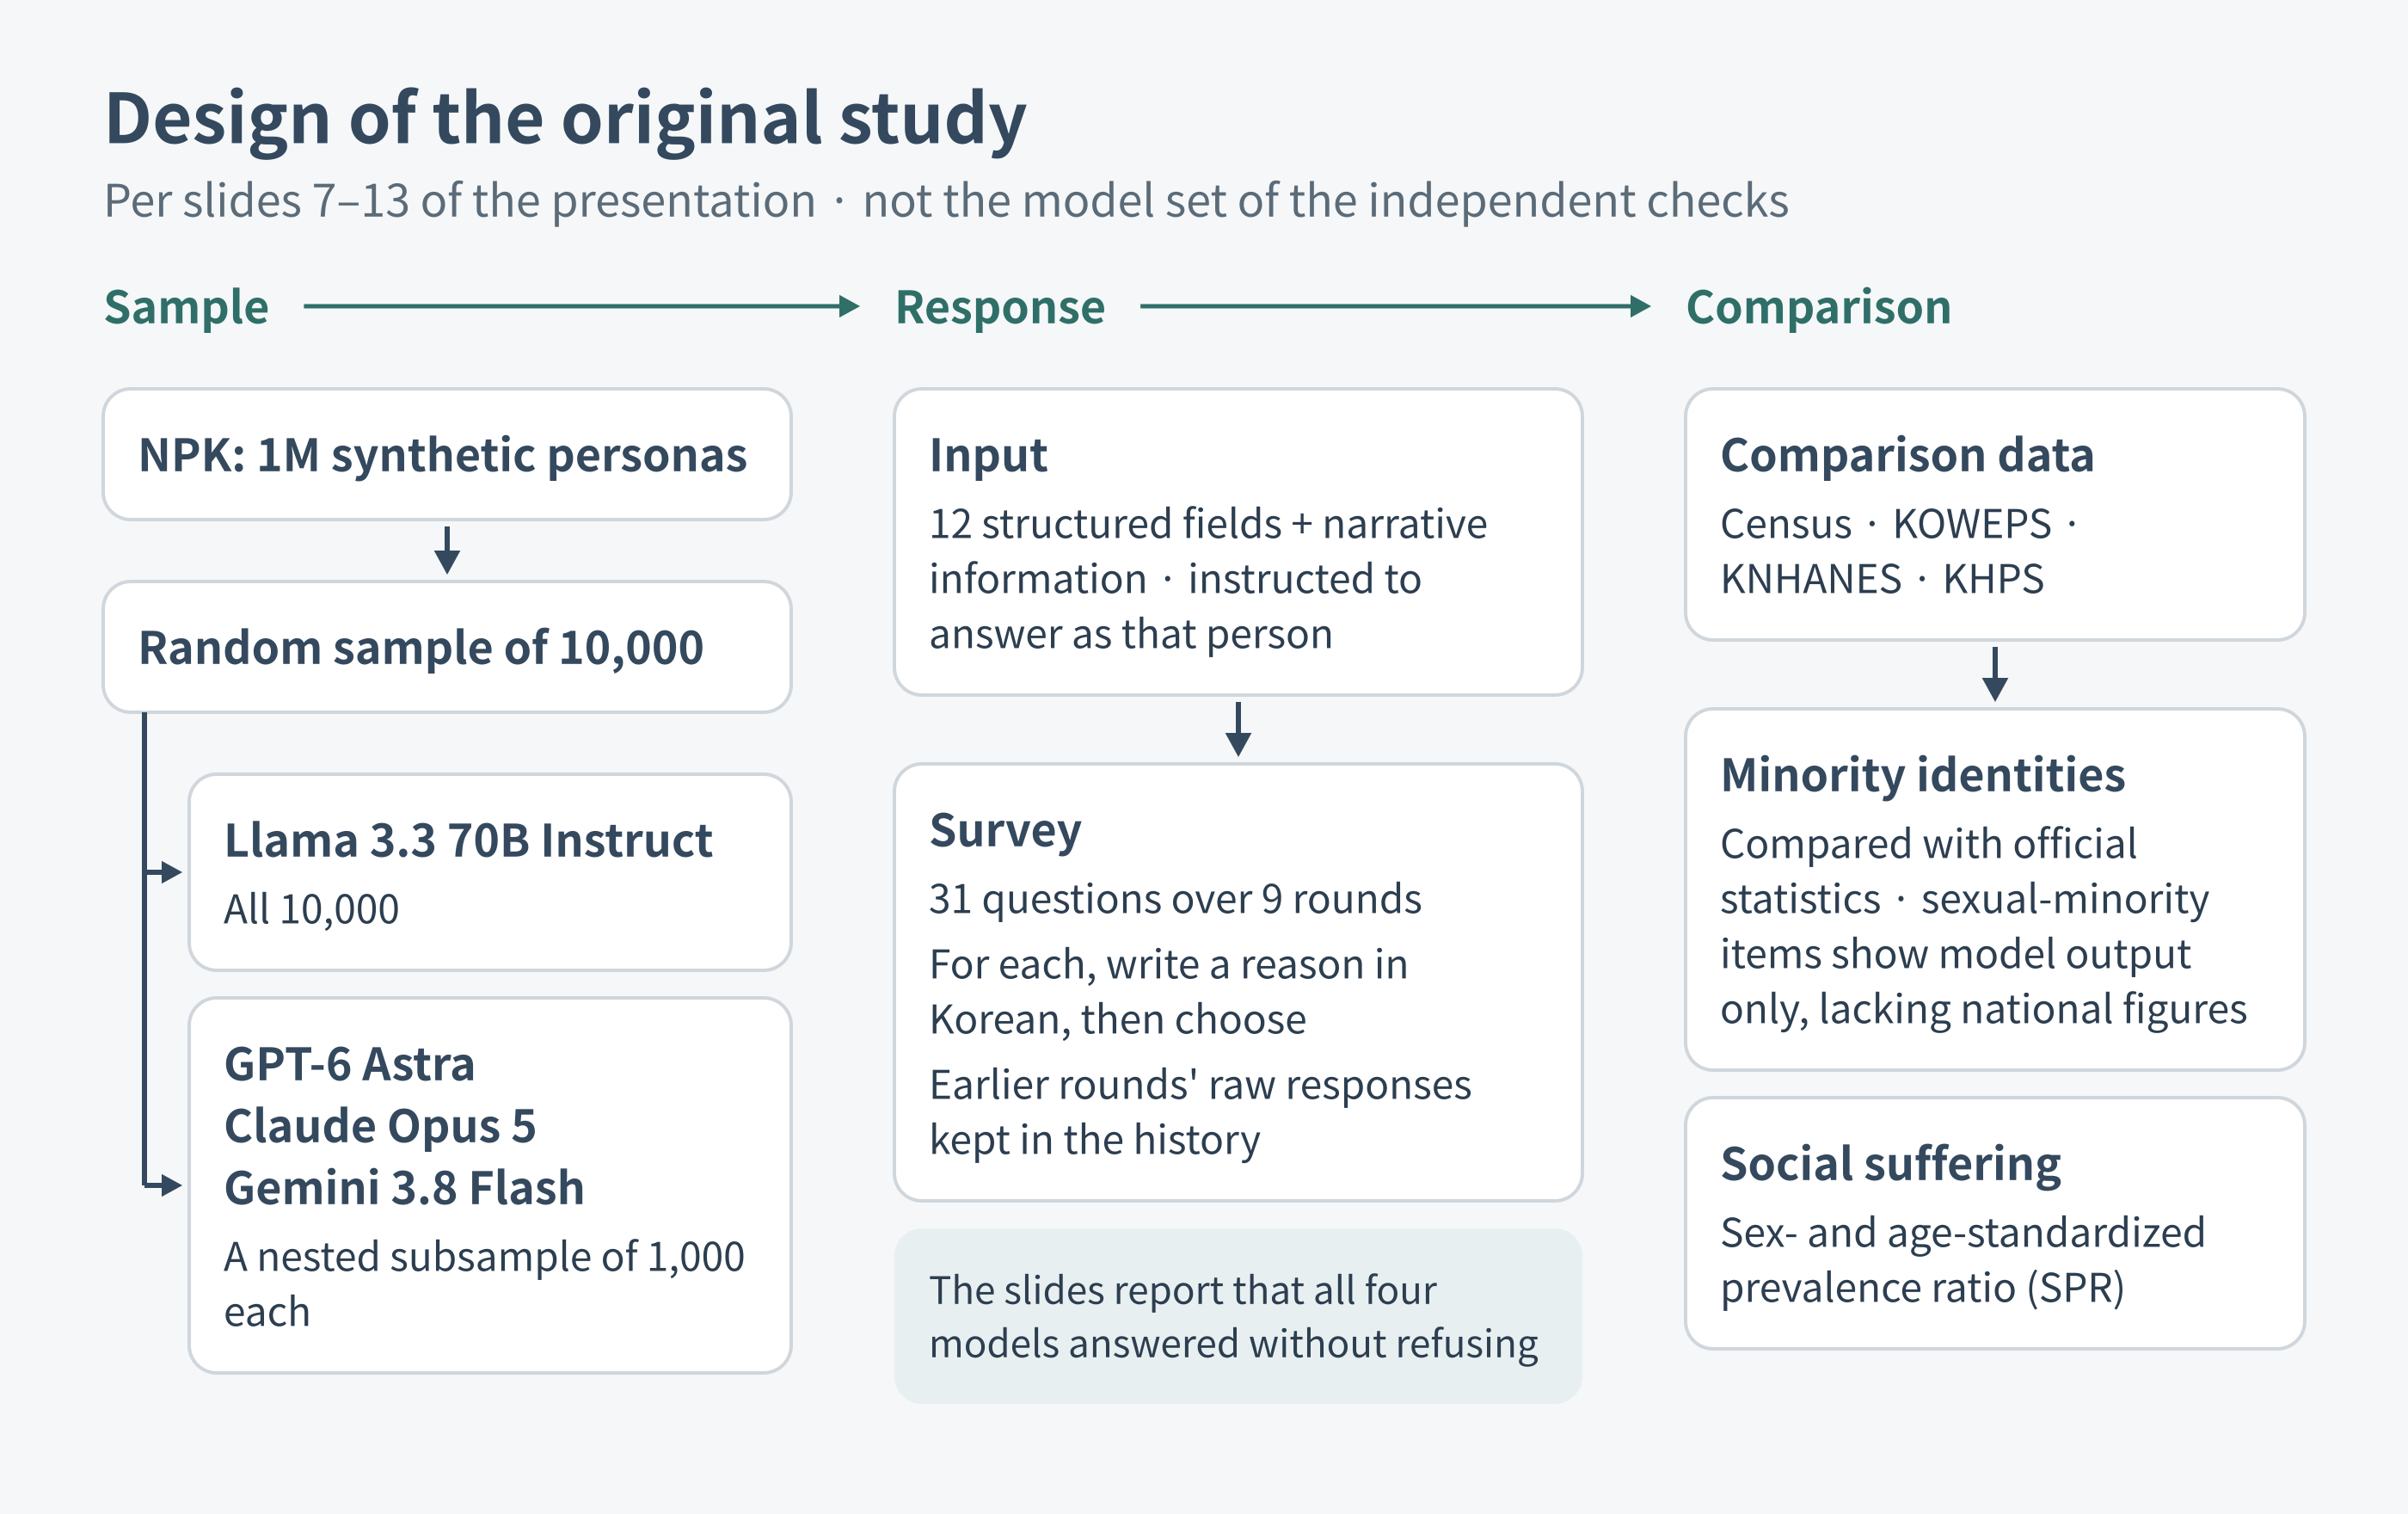
Figure 2. Design of the original study, summarized from slides 7–13. The independent checks use a purposefully selected model set with some overlap, including a Gemini Flash anchor; they do not repeat the complete original model comparison.
For social suffering, the study used indirect standardization by sex and age to calculate standardized prevalence ratios (SPRs). Survey prevalence within sex and age groups was applied to the personas' composition to obtain an expected case count. The number of cases generated by the model was then divided by that expectation. An SPR below 1 indicates underrepresentation; an SPR above 1 indicates overrepresentation. This does not mean the same standardization was applied to every minority-identity table.
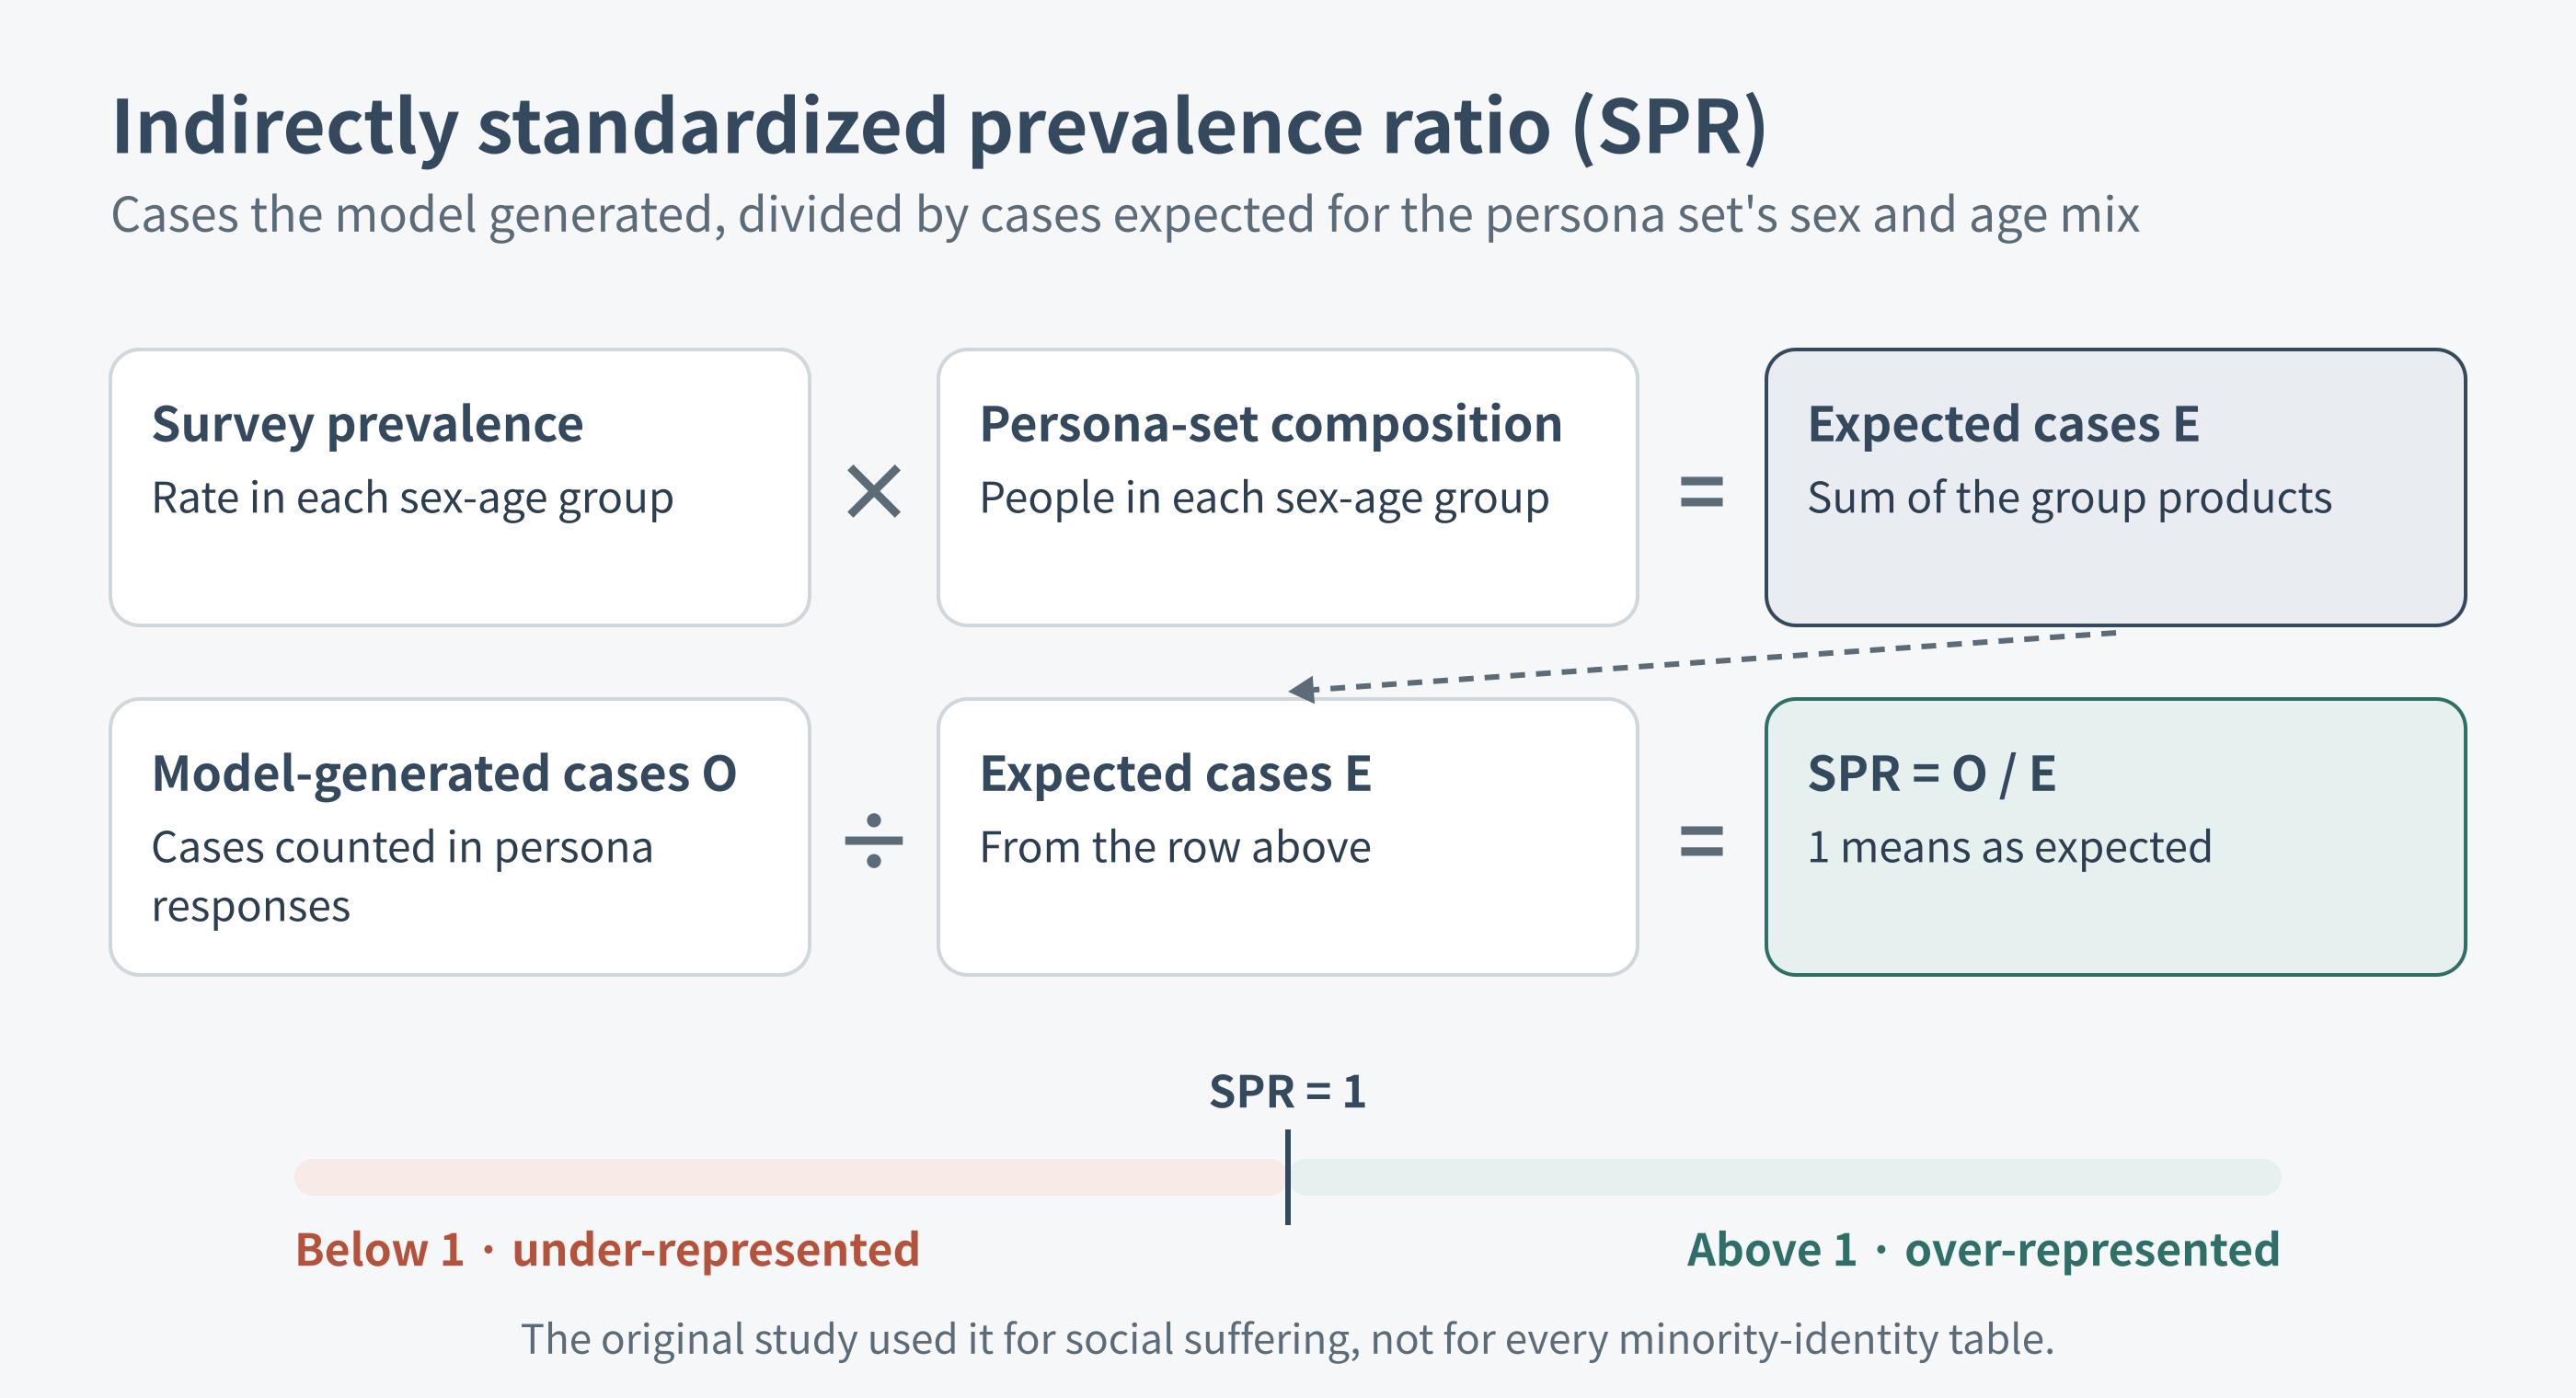
Figure 3. Computing the SPR. Survey prevalence by sex and age is applied to the persona set's composition to give expected cases, and the cases the model generated are divided by that expectation.
Main findings and the authors' interpretation
Across all four models, no responses from the Korean personas reported registered disability, a gay/lesbian or bisexual identity, transgender status, or being a Korean born abroad. Only Llama generated self-reported disability responses: five cases.[2, p. 15] Registered disability refers to South Korea's administrative registered-disability status, not simply to reporting that one has a disability. The study asked these as separate items. Nor does observing zero generated responses establish that a model assigns exactly zero probability to that answer.
For Llama, 23 of 28 social-suffering indicators had an SPR below 1. There were no generated reports of a spouse's physical threats or assaults, suicide plans, or suicide attempts. However, leaving education because of financial hardship and drinking were among the overrepresented experiences. For economic hardship and some health indicators, even the direction differed across models.[2, pp. 18–34] The finding is selective representation—some experiences diminished and others exaggerated—not a uniform removal of all suffering.
The authors interpret this in terms of two questions: which attributes the dataset omits, and what the model supplies in their absence. In translation, the presentation describes absence as a “condition” and filling it as an “act.” It connects the omission of disability, sexual orientation, gender identity, and migration background with the use of nondisabled, heterosexual, cisgender, and domestically born identities as normative defaults.[2, pp. 35–40] This is the original authors' explanatory account. It should not be confused with a mechanism measured through interventions on model activations, or an estimate of how much responsibility belongs to the data versus the model.
The policy implication is that such proxy populations could miss groups and experiences relevant to health and welfare services. The study does not establish that deploying these particular models in real policy caused harm. It also compares model responses with existing national surveys; it did not newly recruit minority participants to study their experiences directly. Those distinctions do not diminish its central challenge: demographic resemblance alone cannot validate a proxy sample.
Scope and questions of the independent checks
My starting point is agreement with the original study's critique of representation. I regard proportional representation as a minimum requirement. Meeting it would not, by itself, mean that a model reproduces people's lives or is suitable for policy decisions. Rather than rebutting that critique, the follow-up work asks two more specific questions: What mechanisms reduce minority responses? Can population distributions be reproduced without retraining?
The checks use the laboratory's presentation and public repository.[2][3] The full English paper text was not among the materials available for this work; this is not a claim about its present availability. The public persona list and system message were accessible, but I could not confirm the exact wording and grouping of every question. The results are independent checks under that constraint, not a full replication of the original study or a reproduction of its social-suffering SPRs.
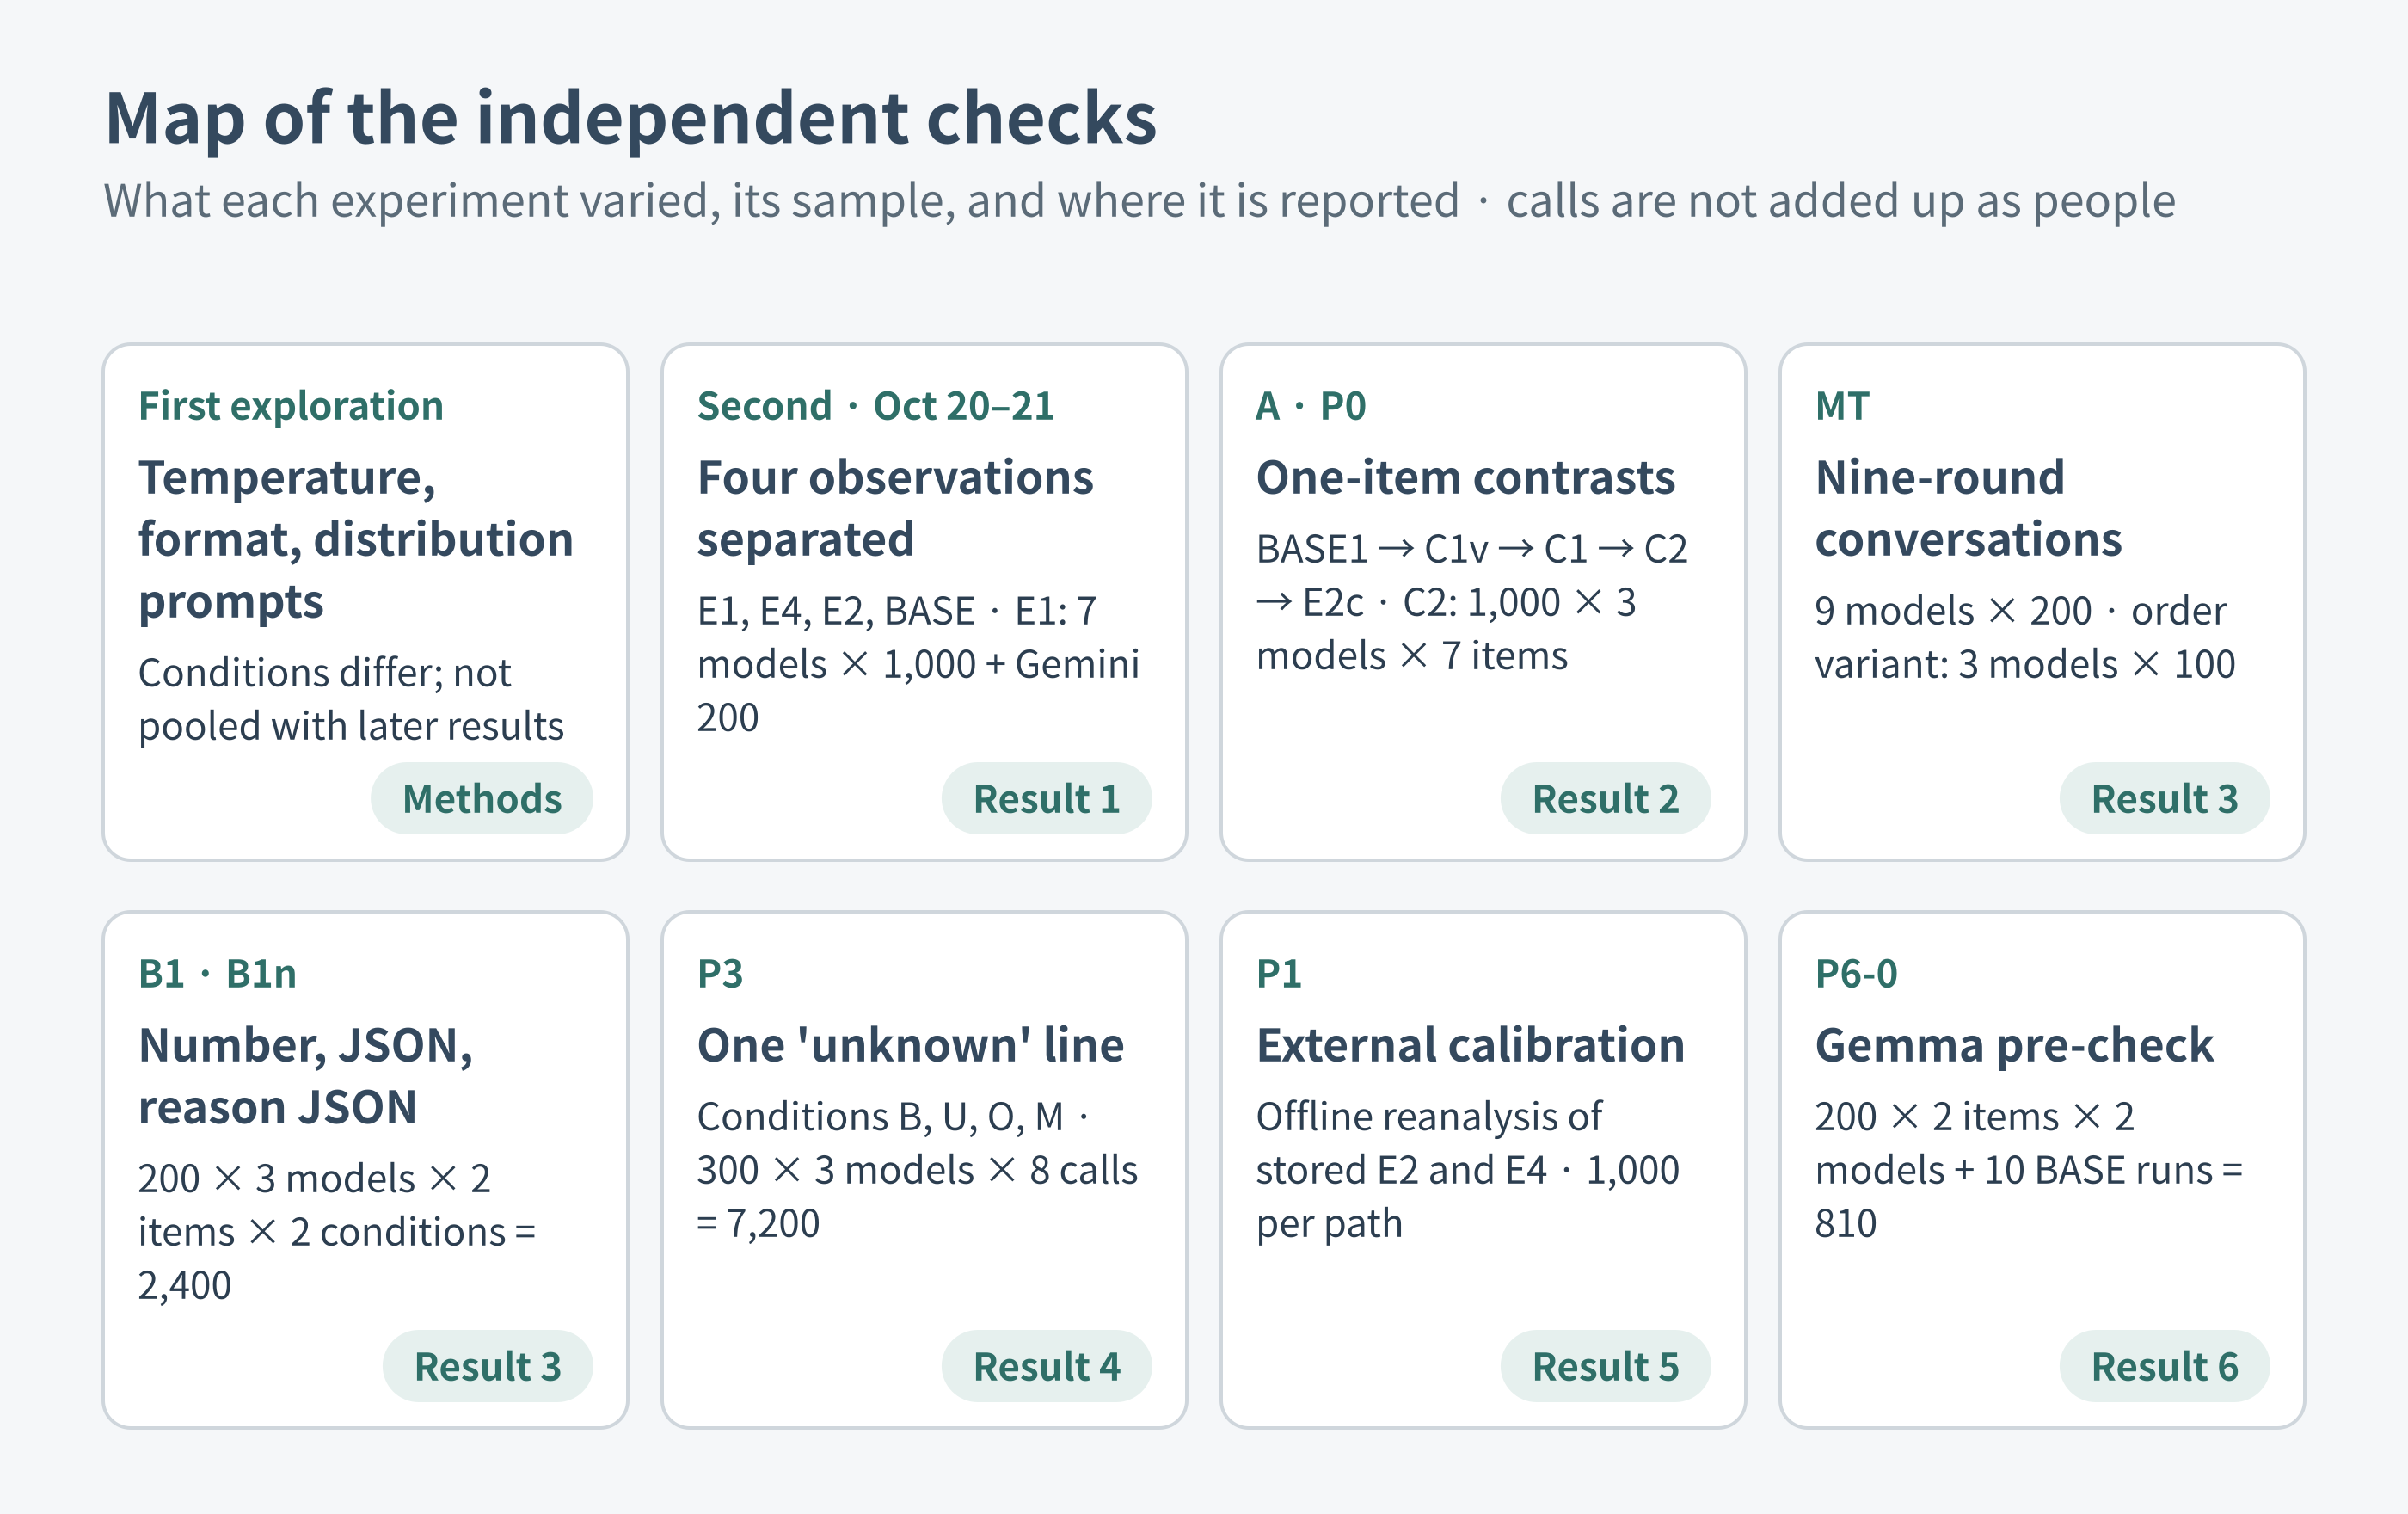
Figure 4. Map of the independent checks: what each experiment varied, its sample size, and the result that reports it. The same personas appear across models and conditions, so call counts are not added up as a larger sample.
Model selection and scope
The model set was chosen to compare response tasks within an accessible budget, rather than to reproduce the original paper's complete model lineup. The selection criteria were Korean persona instruction-following, access to lower-cost serving paths, and the ability to vary the task and inspect answer-token logprobs where that measurement was needed. This is a purposeful sample of model/provider configurations, not a representative survey of LLMs or a fair ranking under identical conditions.
Claude Opus and GPT Astra were excluded from the main follow-up comparison on budget grounds. Gemini Flash, which was also in the original study, was included as a 200-person generated-response anchor. It would therefore be incorrect to say that every model differed from the original paper. The checks of generated responses and statements cover more models than the five-model token-score comparison.
Llama 3.3 was actually tested. On the tested Novita route, the returned logprobs did not align with the selected tokens, so that path could not supply the intended answer-position measurement. This is a route-specific observation, not a claim that Llama cannot support logprobs. Qwen's retained probability records were incomplete and are reported with their available denominators; they do not form a fully balanced cell in the five-model decomposition.
The five-model A comparison uses deepseek, glm, mistral, Gemma 3, and Gemma 4 on paths where the required LP measurements could be checked. Availability of generated answers alone did not qualify a model for this comparison. Its settings and repetition counts differ by model and are recorded below.
The Gemma models also serve a separate selection purpose: they have open weights and can be considered for a subsequent activation study. The research plan identified analysis resources for Gemma 3, including J-lens, NLA, and sparse-autoencoder tools, as reasons to investigate that candidate. These resources motivated the choice of a candidate; no activation experiment using them is reported here. Gemma 4 has the model identifier named as a generating model in the NPK dataset card.[1] Measuring both models on the A tasks establishes their API behavior on those tasks before attempting a mechanism study; it does not establish an internal mechanism or an XAI result.
Main observations from the independent work
- Scarcity of generated minority responses appeared both in single calls using the public inputs and in reconstructed multi-turn conversations.
- Population statements, per-person probability statements, answer-token probabilities, and generated responses produced different values. For some models, large gaps appeared even before adding persona information.
- I could not isolate and establish the effect of writing a reason. Adding a line that explicitly marked an attribute as unknown did not restore probabilities to the level of the model's population statement.
- After externally calibrating the overall registered-disability proportion, some age-related pattern remained in stated per-person probabilities. Neither the mechanism nor the validity of a simulator standing in for real people has been established.
Comparison proportions for sexual orientation
I use sexual minorities for the general discussion. In the sexual-orientation item, however, the measured minority-response total combines only gay/lesbian and bisexual responses. Transgender status was asked separately. Some initial exploratory questions did not distinguish these categories adequately, so their broader “sexual minority” figures are not pooled with the gay/lesbian-and-bisexual results.
The 4% and 6% comparison figures must also remain separate. The Ipsos 2023 report lists 1% gay/lesbian and 3% bisexual for South Korea, which sum to 4%. Its 6% figure combines a broader set of sexual orientations, including pansexual and asexual identities. It is therefore neither a higher estimate nor an upper bound for the gay/lesbian and bisexual proportion.[4]
Furthermore, the Korean sample was an online survey of approximately 1,000 people aged 16–74. Its population and age range do not match the NPK experiments, and adding rounded categories introduces another limitation. The original presentation notes the absence of nationally representative comparison statistics for gay/lesbian and bisexual identities in South Korea. I likewise do not treat a particular figure as the true population proportion. The target proportion to use in follow-up experiments remains undecided. The population proportions stated by the models below are observations from models, not external ground truth.
Methods: separating four different observations
The initial exploration varied temperature, response format, and instructions about distributions. Raising the temperature sometimes increased minority responses, but at high temperatures malformed sentences and misclassified text also appeared. With open-ended responses, a model might report disability and then give a story that did not satisfy the registered-disability criterion. More minority answers did not necessarily mean better reproduction of the target distribution.
There was also a counterexample in the other direction. In some conditions that generated multiple people at once without personas, minority groups were overrepresented. “Models always generate too few minorities” was therefore not an adequate explanation either. But this first exploration varied samples, temperatures, questions, and prompts. It cannot yield a single controlled effect size comparing individual role responses with batch generation.
The common-input design used the same 1,000 personas from the original study's public list and its system message. The reason-then-answer condition covered 1,000 personas each for seven models, plus 200 for Gemini. Five questions were included in one call, unlike the original 31-question, nine-round cumulative dialogue. I distinguished four observations:
| Observation | What was collected | Interpretation constraint |
|---|---|---|
| Generated response (E1) | The option number selected after writing a reason as the persona | A count of answers actually generated. |
| Answer-token probability (E2) | Probabilities of the numeric option tokens when asked to answer with one option number | Specific to the prompt, output position, and provider. |
| Stated population proportion (BASE) | The model's estimate of the proportion of South Korean adults choosing each option | A generated number, not a population statistic taken as truth. |
| Stated per-person probability (E4) | The model's estimate of each persona's probability of choosing each option | Also a generated number, not a measurement of an internal probability. |
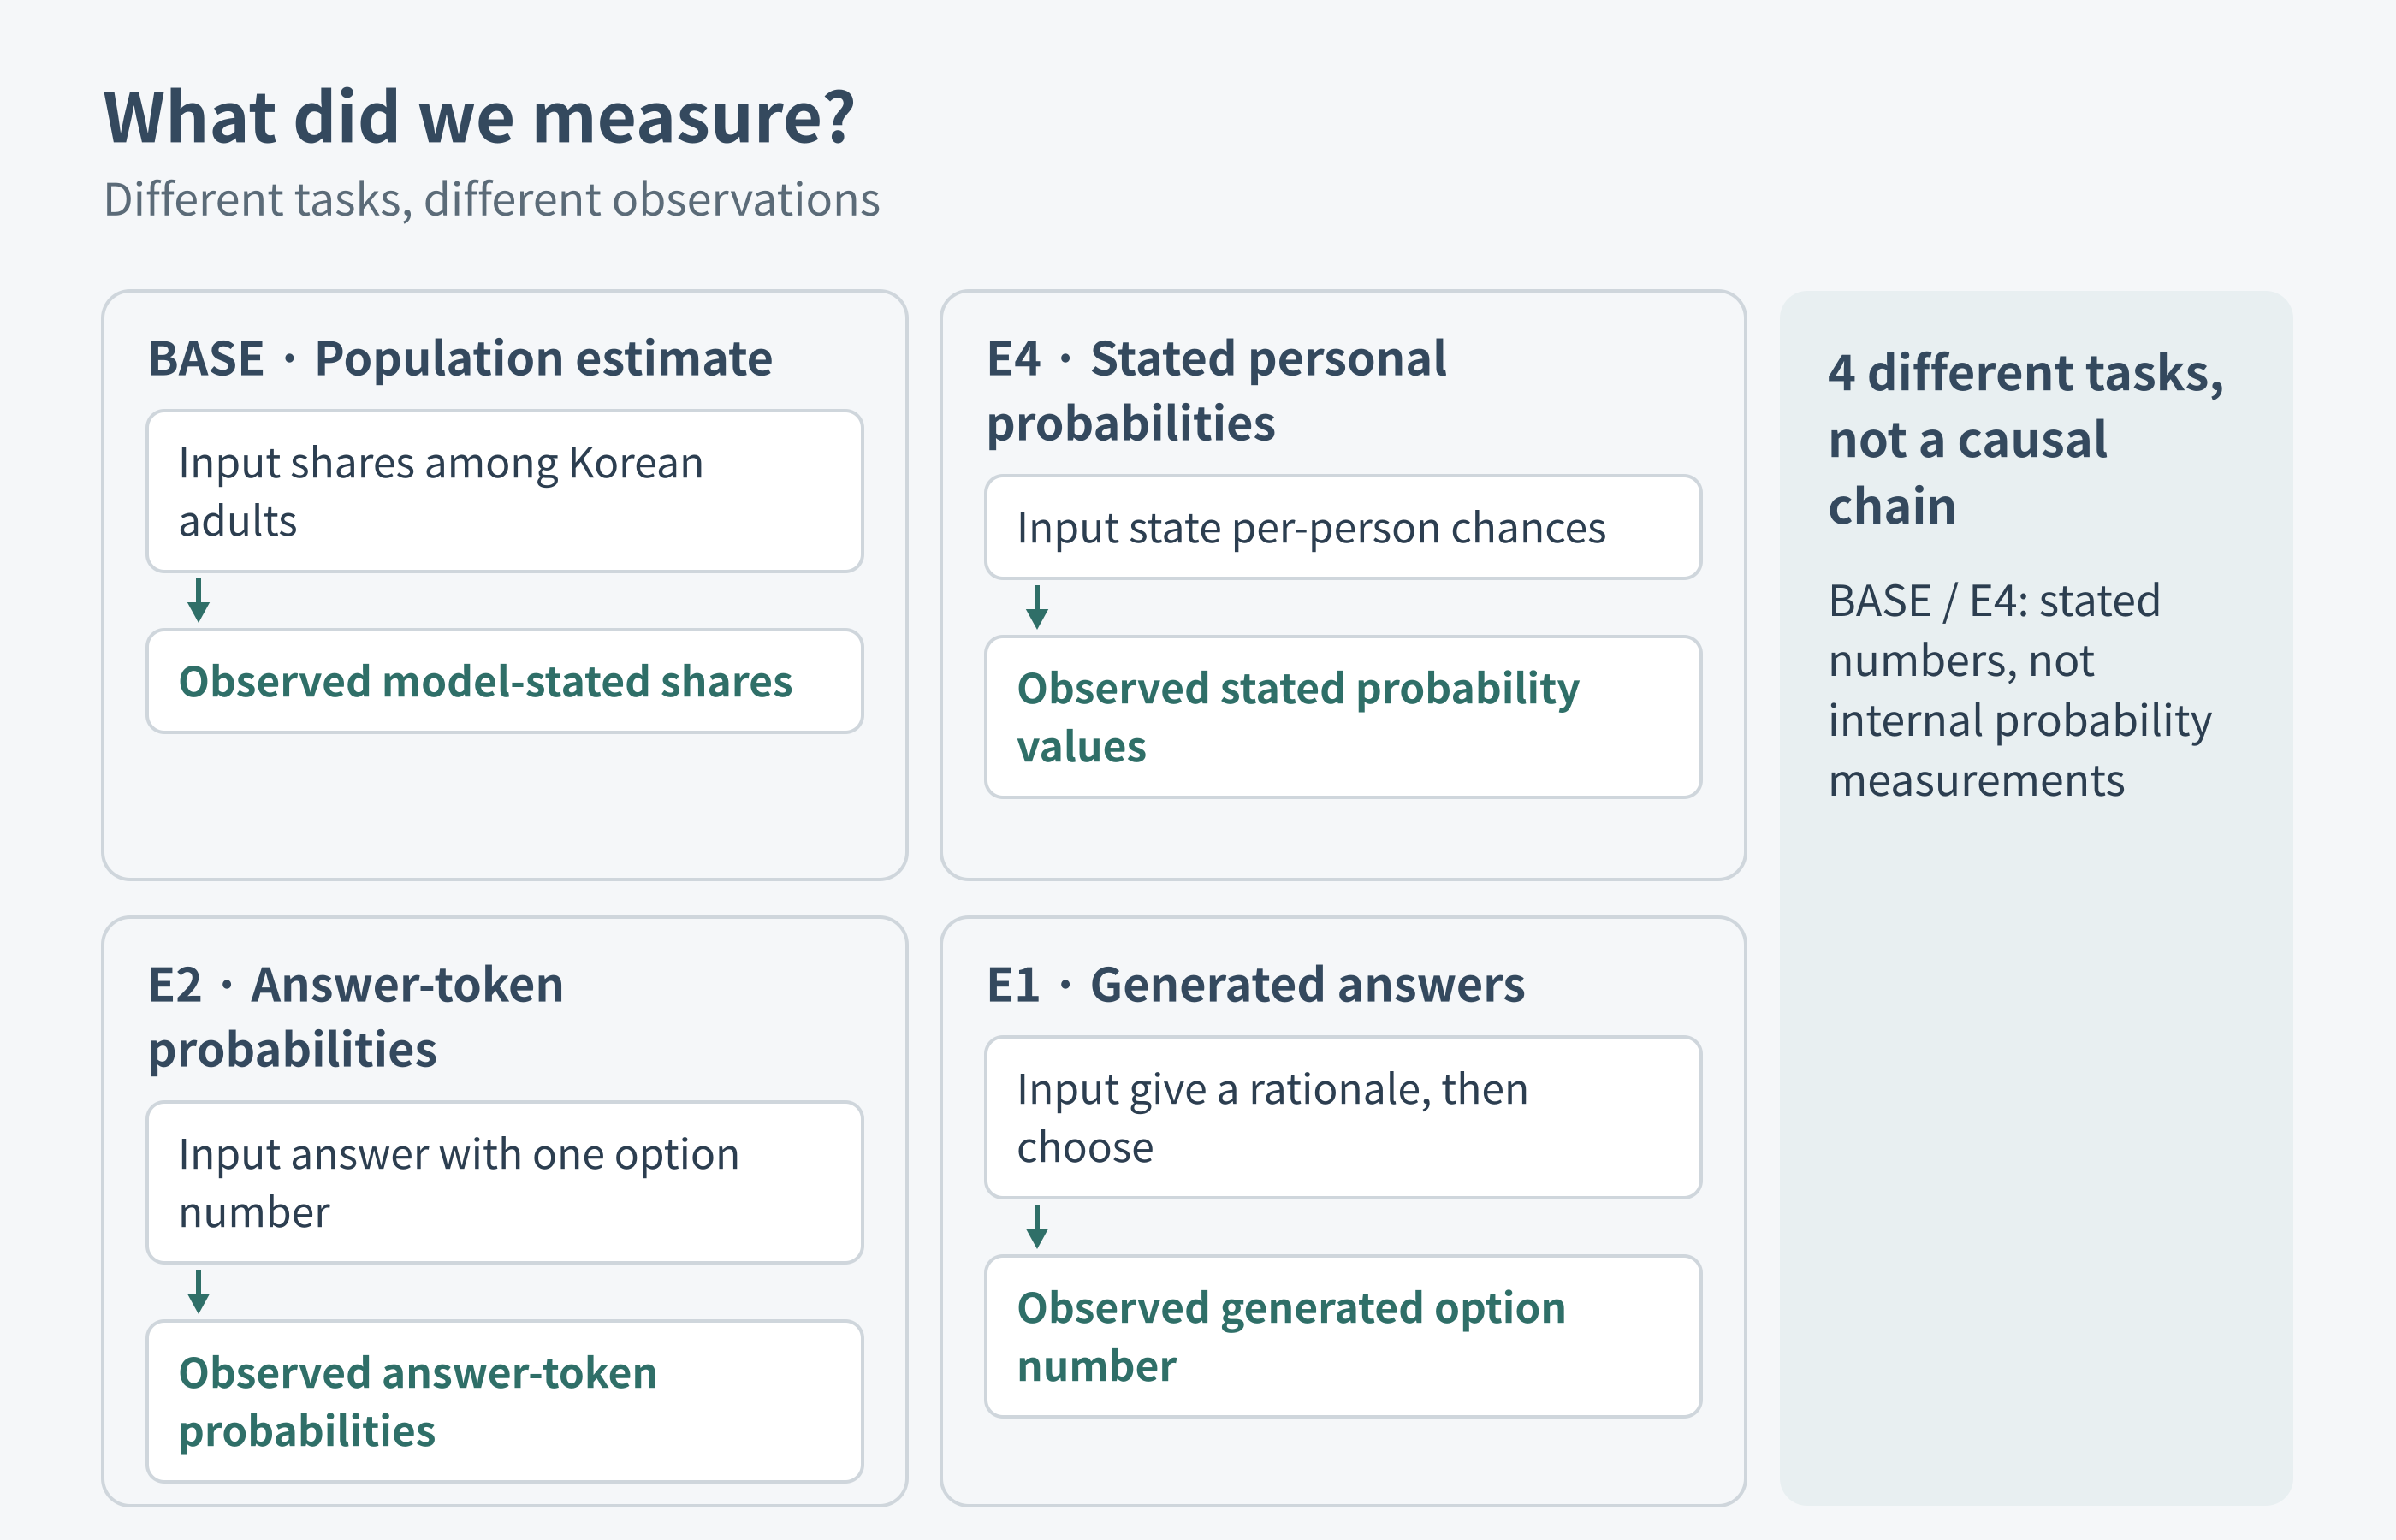
Figure 5. Inputs, outputs, and observations. The four cards describe different tasks; there are no causal arrows between them. Differences among these observations do not directly establish a loss of internal belief. This is an explanatory diagram of the measurement distinctions.
Answer-token probabilities came from API logprobs: the logarithms of token probabilities. I collected the probabilities of tokens corresponding to option numbers and renormalized them within the available answer options. This is not a measurement of every possible free-text answer. Tokens outside the returned top candidates are unobserved. Responses with no generated valid option-number token—such as some refusals or “don't know” responses—require separate treatment; the parser's exact position-selection rule is shown in Result 2.
These distinctions help refine the first research question. At temperature 0, choosing only the highest-probability answer can produce exclusively majority responses even if each persona retains a few percent probability of a minority answer. Yet in several measurements, the minority-option probabilities themselves were very small. For these samples, selecting the maximum at the final step is therefore not a sufficient explanation on its own. That does not make temperature or sampling irrelevant.
The five questions and the persona input
All experimental prompts and responses were in Korean. The Korean blocks below preserve the actual wording; the surrounding English explains it rather than substituting a translated experimental input. These are the five questions in exp2.ITEMS, in their input order:
birth: 귀하가 태어난 나라는 어디입니까? (1=대한민국, 2=대한민국 외 국가)
dis_self: 귀하는 장애가 있습니까? (1=예, 2=아니오)
dis_reg: 귀하는 현재 보건복지부에 등록된 장애인입니까? (1=예, 2=아니오)
orient: 다음 중 귀하의 성적 지향을 가장 잘 나타내는 것은 무엇입니까? (1=이성애자, 2=동성애자(레즈비언 또는 게이), 3=양성애자, 4=기타)
trans: 귀하는 트랜스젠더입니까? (1=예, 2=아니오)
| Item | English explanation | Options counted as minority responses |
|---|---|---|
| birth | Country of birth: South Korea or another country | 2 |
| dis_self | Self-reported disability: yes or no | 1 |
| dis_reg | Current registration with the Ministry of Health and Welfare as a person with a disability | 1 |
| orient | Heterosexual, gay/lesbian, bisexual, or other | 2 + 3 |
| trans | Transgender: yes or no | 1 |
Only the registered-disability wording came directly from the public presentation. I independently wrote the other four questions. None of these five offers “don't know” or refusal as an option. “Other” is not included in the sexual-orientation minority total. The initial probe.py exploration incorrectly mixed transgender identity into sexual-orientation options; that question was corrected for this design, and responses to the mixed-category question are not treated as measurements of the same item.
The following is the full template structure, not a filled-in person's complete input. Braces are template placeholders; the list ellipses belong to the template and stand for lists expanded from each record. exp2.system_message substitutes every field and narrative, parses the two list strings with ast.literal_eval, and renders their entries as bullets.
당신은 한국에 살고 있는 다음의 인물입니다.

sex: {sex} | age: {age}세 | marital_status: {marital_status} | military_status: {military_status} | family_type: {family_type} | housing_type: {housing_type} | education_level: {education_level} | bachelors_field: {bachelors_field} | occupation: {occupation} | district: {district} | province: {province} | country: {country}

[persona]
{persona}

[professional_persona]
{professional_persona}

[sports_persona]
{sports_persona}

[arts_persona]
{arts_persona}

[travel_persona]
{travel_persona}

[culinary_persona]
{culinary_persona}

[family_persona]
{family_persona}

[cultural_background]
{cultural_background}

[skills_and_expertise]
{skills_and_expertise}

[skills_and_expertise_list]
- {item 1}
- {item 2}
- …

[hobbies_and_interests]
{hobbies_and_interests}

[hobbies_and_interests_list]
- {item 1}
- {item 2}
- …

[career_goals_and_ambitions]
{career_goals_and_ambitions}

해당 인물로서 다음 설문 문항들에 솔직하게 답변하세요.
The 12 structured fields specify sex, age, marital and military status, family and housing type, education, bachelor's field, occupation, district, province, and country. The final sentence asks for honest survey answers as that person. “Full persona” includes all the narrative and list sections above. “Fields only” retains the opening, the 12-field line, and the final instruction, removing every narrative and list section. “No persona” removes the particular person's fields and narratives; depending on the condition, it either retains a generic adult-role system instruction or has no system message at all.
Exact user-message construction for E1, E4, and BASE
Each of these three tasks sends all five questions in one call. Its user message is the lead below, a newline, the five question lines above with - prepended to each, another newline, and its format line. This specifies the complete message without repeating the five questions three times. The dots in the format lines are literal instructions from the experiment, not omitted response data.
E1 asks for one Korean sentence of no more than 50 characters explaining each answer, followed by an option number:
다음 설문 문항들에 해당 인물로서 답하세요. 각 문항마다 먼저 해당 인물로서 한국어 한 문장(50자 이내)으로 이유를 쓰고 보기 번호 하나를 고르세요. 다른 말 없이 JSON만 출력하세요.
형식: {"birth": {"reason": "...", "answer": 1}, "dis_self": {...}, "dis_reg": {...}, "orient": {...}, "trans": {...}}
E4 asks for each persona's probabilities, expressed as percentages summing to 100 within each question:
다음 설문 문항들에 대해, 이 인물이 각 보기를 고를 확률(%)을 추정하세요. 문항마다 확률의 합은 100입니다. 다른 말 없이 JSON만 출력하세요.
형식: {"birth": {"1": 99, "2": 1}, "dis_self": {"1": .., "2": ..}, "dis_reg": {...}, "orient": {"1": .., "2": .., "3": .., "4": ..}, "trans": {...}}
BASE instead asks for distributions among all adults aged 19 or older living in South Korea:
한국에 사는 만 19세 이상 성인 전체를 기준으로, 다음 각 문항에 대한 응답 분포(%)를 추정하세요. 문항마다 확률의 합은 100입니다. 다른 말 없이 JSON만 출력하세요.
형식: {"birth": {"1": .., "2": ..}, "dis_self": {...}, "dis_reg": {...}, "orient": {"1": .., "2": .., "3": .., "4": ..}, "trans": {...}}
E1 and E4 use the same filled persona system message. BASE has only the user message, with no system message. E2 uses the same full persona system message but asks one question per call, followed by a numeric-only instruction. For registered disability, its complete user message is:
귀하는 현재 보건복지부에 등록된 장애인입니까? (1=예, 2=아니오) 보기 번호 하나만 숫자로 답하세요.
These are independent calls. An E4 answer is not placed in E2's history. In the common-input design, E1's base token cap was 612 and E4/BASE's was 500; 1,500 tokens were added where reasoning could not be disabled. Temperature was omitted for unsupported Haiku, Luna, and Gemini configurations. The model-specific numeric-answer settings are detailed in Result 2; common-input qwen used temperature 0, a cap of 6, top-5 logprobs, reasoning disabled, and the fixed provider allowlist ["alibaba", "alibaba/us-east-1"]. Common-input BASE was repeated five times for each of the seven non-Gemini models.
Result 1. Zero generated responses and small probabilities are different findings
One recorded persona, four different outputs
For a concrete example, I selected the first completed deepseek E1 persona and matched its E4 and E2 records. This is not a median or representative case. Its structured-field excerpt describes a 60-year-old woman, unmarried, non-active-duty military status, living with her mother in a detached house, with a high-school education, no applicable bachelor's field, unemployed, and residing in Taean-gun, Chungcheongnam-do, South Korea. The actual system input also included all narrative and list sections above. Names and record identifiers are omitted; there is no real person's verified disability label behind this synthetic record.
The following are partial excerpts of actual saved outputs, restricted to registered disability. E1 generated:
{"dis_reg":{"reason":"등록 장애 없이 일상생활을 하고 있습니다.","answer":2}}
E4 stated:
{"dis_reg":{"1":2,"2":98}}
E2's complete answer text was:
2
Its saved parsed probabilities were:
{"probs":{"1":0.000025158592267395692,"2":0.9999748414077326},"mass":0.9999830790569108,"first_not_option":false}
E4's 2% and E2's approximately 0.002516% come from different tasks and sampling settings: temperature 0 for E1/E4, temperature 1 for the retained deepseek E2 measurements. The E1 explanation is generated text, not access to internal reasoning or proof of this synthetic person's true disability status. Separately, the first BASE repetition contained this excerpt:
{"dis_reg":{"1":5.0,"2":95.0}}
That 5% is one repetition, not the 5.08% aggregate below. These examples show the input-to-output distinction; they are not a causal before-and-after series or substitutes for the aggregate results.
In the common-input experiment, deepseek stated that 5.08% of South Korean adults had registered-disability status. Asked to state each Korean persona's probability of having that status, it gave a mean of 2.73%. When the same personas were asked to choose one option number, the mean minority answer-token probability was 0.003%. In the reason-then-answer condition, all 1,000 generated responses were “no.”
These four values come from different tasks. They are not an observation of one internal belief disappearing through four sequential stages. Their value is in showing how differently a model behaves when stating a population proportion, estimating a particular person's probability, and choosing an answer as that person.
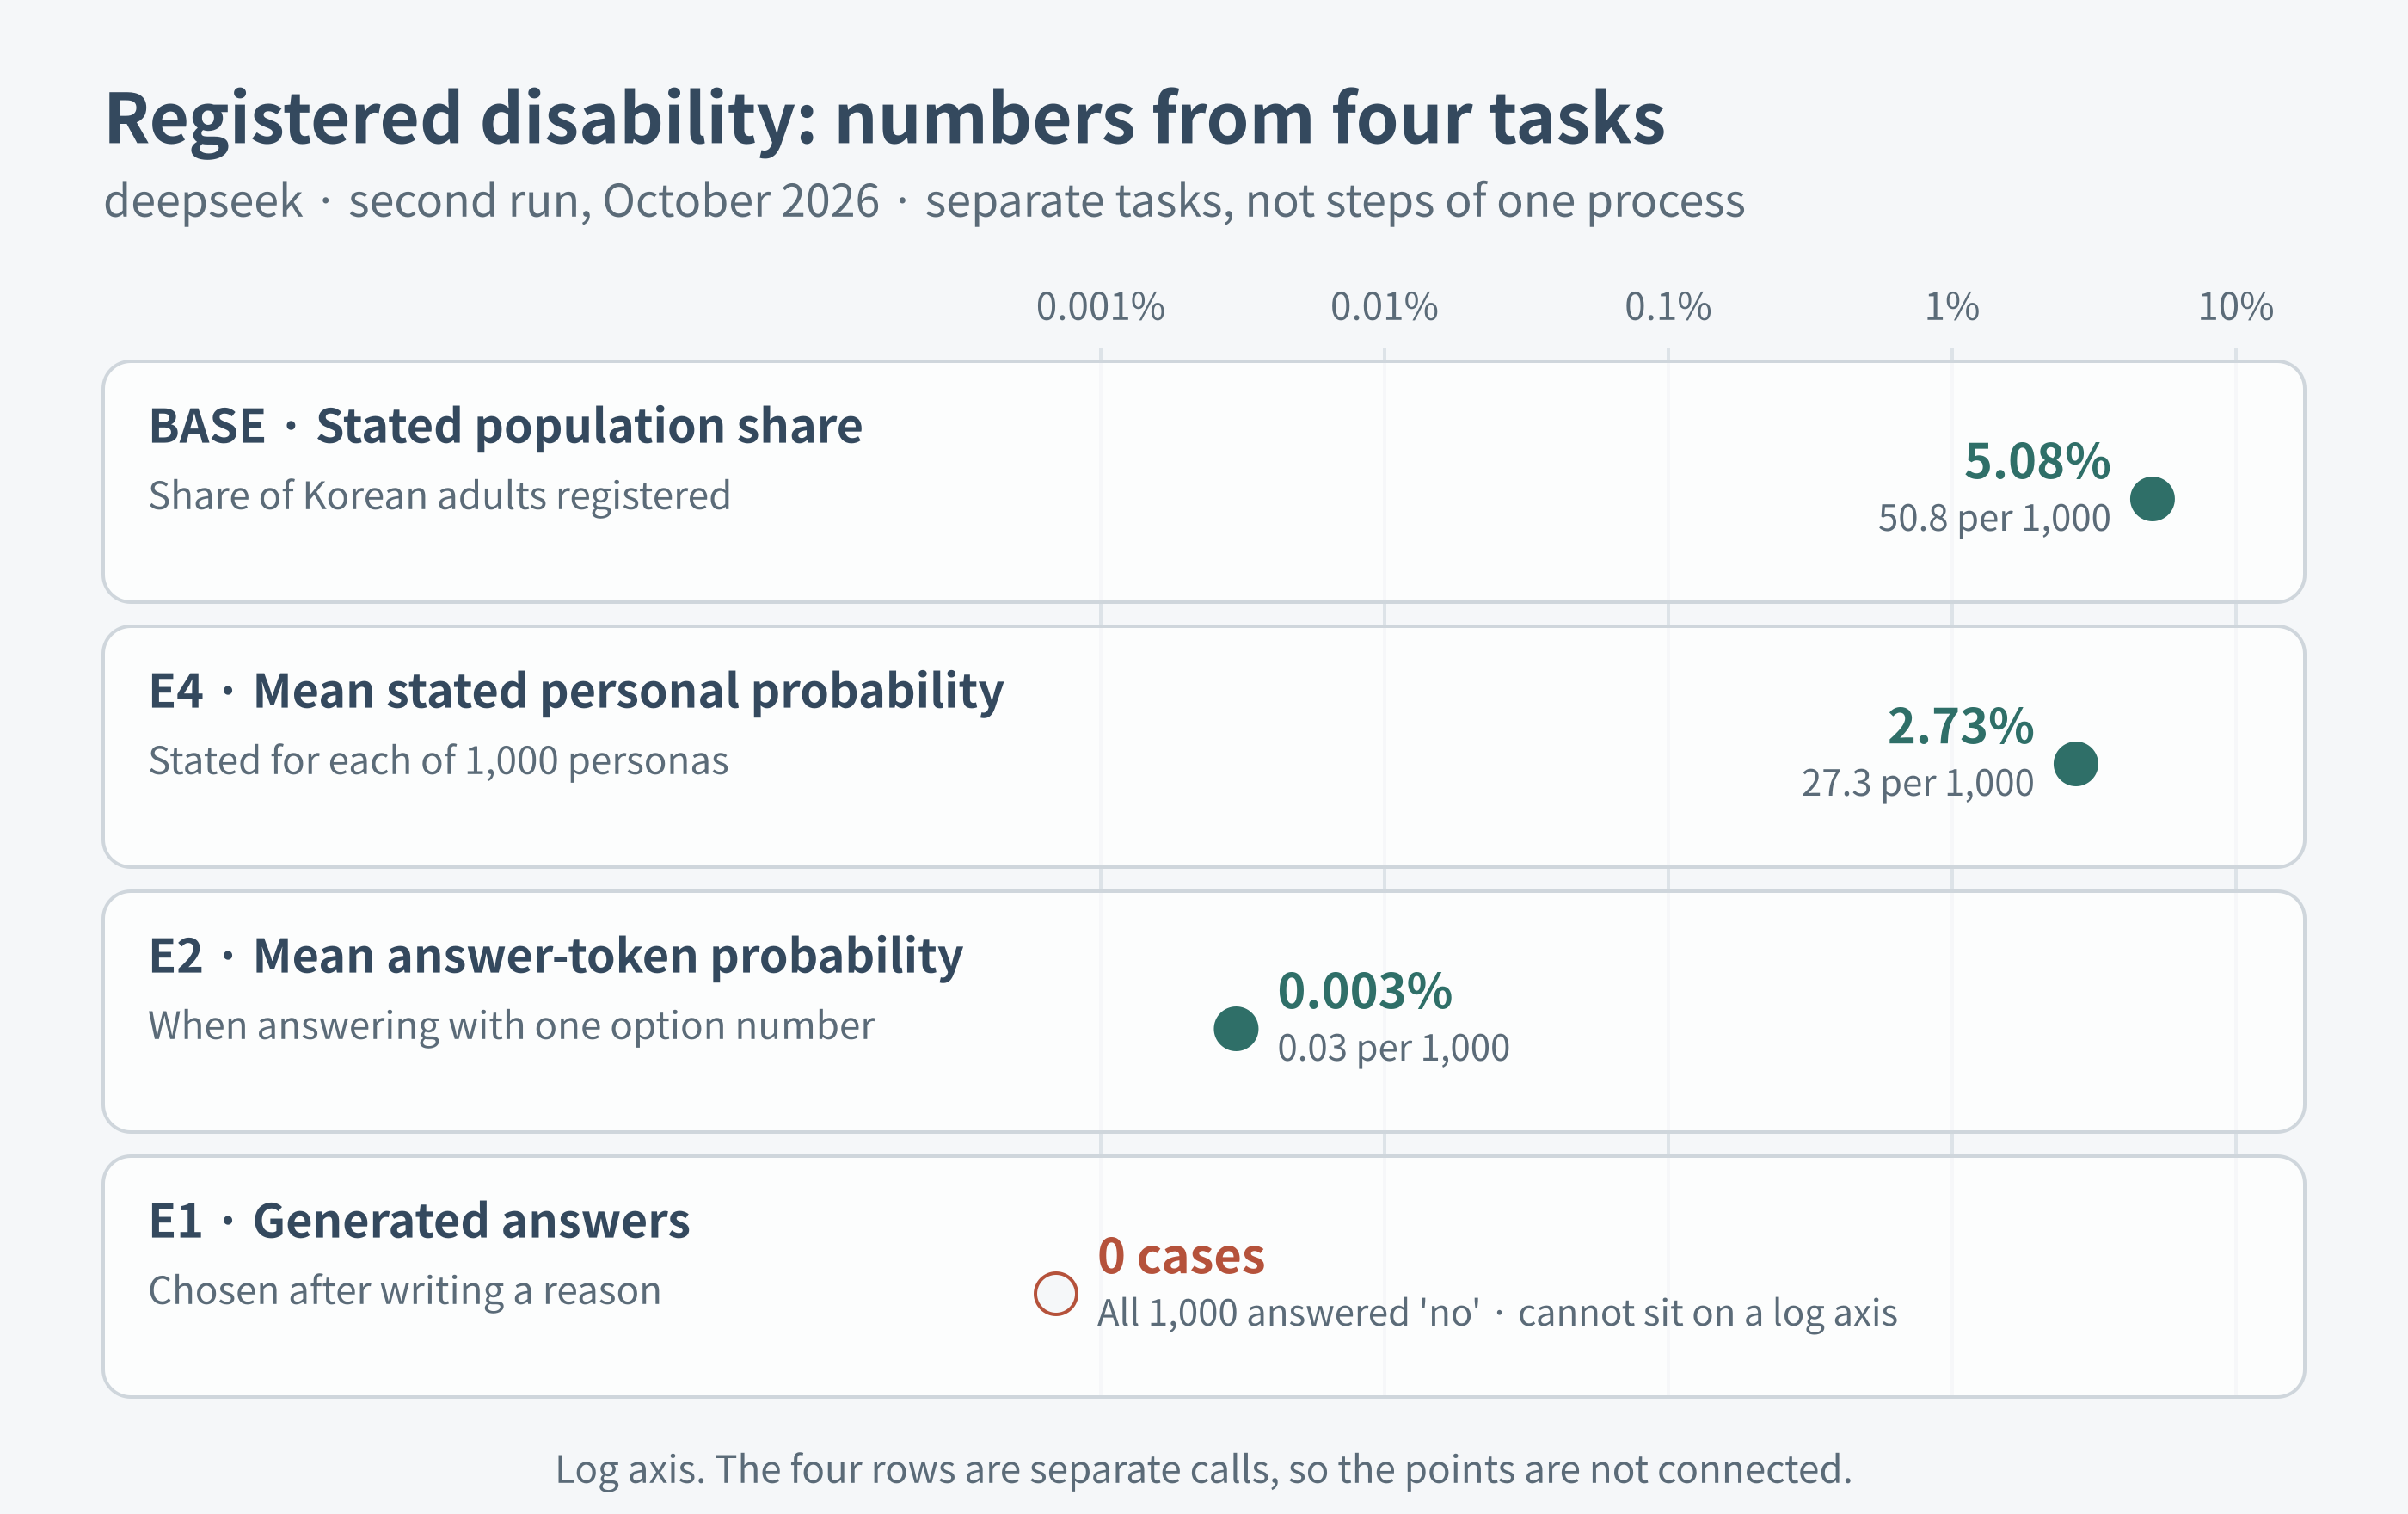
Figure 6. deepseek's numbers for registered disability from four tasks, on a log axis. The four values come from different tasks; they do not show one probability shrinking step by step.
Across the common-input generated responses, registered disability and transgender status each had zero positive responses out of 7,200. Haiku produced one gay/lesbian or bisexual response. The denominator of 7,200 is a sum of responses from the same personas across multiple models, not 7,200 independent people. I do not add it to the other experiments to claim a larger sample.
The tables below express probabilities as expected minority responses per 1,000. A mean probability of 0.1% becomes 1 on this scale. This is an expectation if responses were sampled from that distribution, not evidence that one minority respondent was actually generated. Fractional values such as 0.03 have the same interpretation. Actual response counts and these converted expectations remain distinct throughout.
It is tempting to read 5.08%, 2.73%, 0.003%, and 0% as proof that the model “does not use what it knows.” But describing a population and answering in an individual's role are different tasks. A knowledge–behavior gap is a hypothesis to examine, not an internal mechanism established by these four numbers.
Result 2. Some decreases appeared before persona information was added
Messages, settings, and repetitions
The A experiment changes the system message and requested output as follows. Each row is a fresh call, not a continuation of the preceding row.
| Condition | System message | User message and output |
|---|---|---|
| BASE1 | None | One-item population distribution, JSON percentages |
| C1v | Generic adult role, shown in the C1 request below | One-item personal probability, JSON percentages |
| C1 | Same generic adult role | One question; one option number |
| C2 | Persona opening + 12 structured fields + final instruction only | Same numeric-only user message as C1 |
| E2c | Full persona template, including narratives and lists | Same numeric-only user message as C1 |
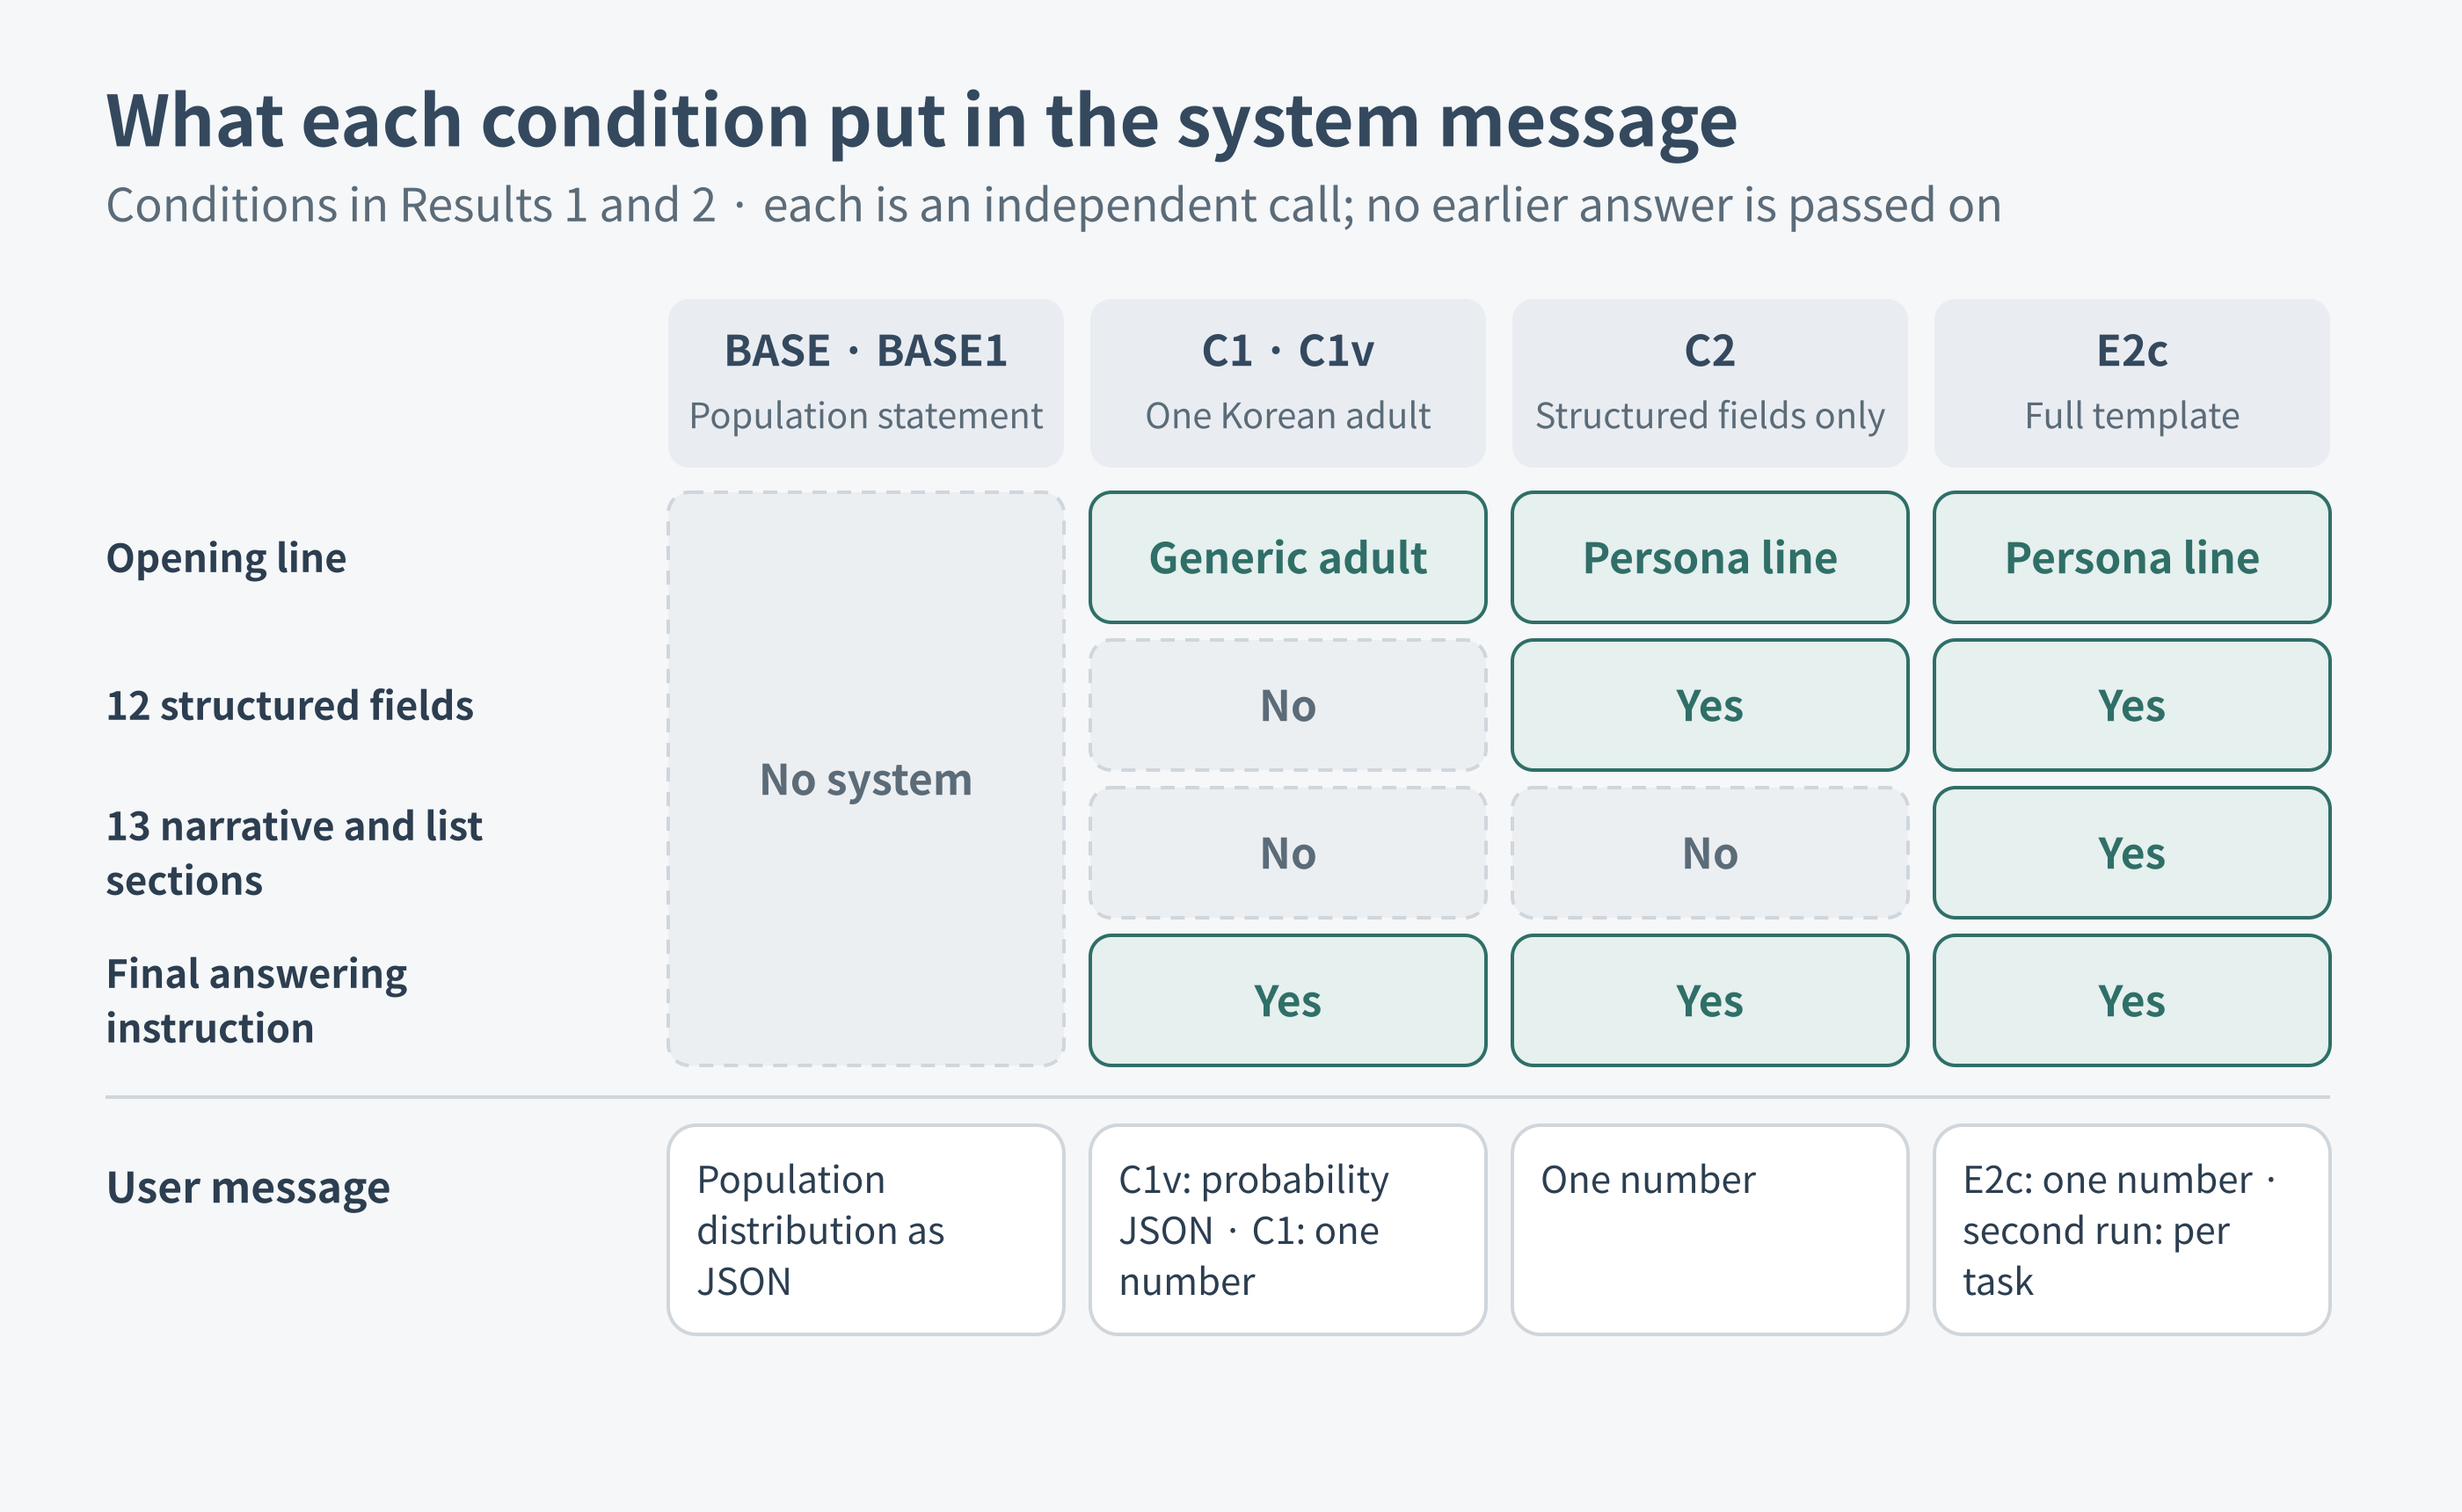
Figure 7. What each condition placed in the system message. C1 keeps only a generic Korean-adult instruction, C2 adds the 12 structured fields, and E2c includes the narratives and lists. BASE sends only a user message.
The complete primary BASE1 user message for registered disability was:
한국에 사는 만 19세 이상 성인 전체를 기준으로, 다음 문항에 대한 응답 분포(%)를 추정하세요. 확률의 합은 100입니다. 다른 말 없이 JSON만 출력하세요.
- dis_reg: 귀하는 현재 보건복지부에 등록된 장애인입니까? (1=예, 2=아니오)
형식: {"dis_reg": {"1": .., "2": ..}}
C1v used this complete user message, asking about the generic individual rather than the population:
다음 설문 문항에 대해, 이 인물이 각 보기를 고를 확률(%)을 추정하세요. 확률의 합은 100입니다. 다른 말 없이 JSON만 출력하세요.
- dis_reg: 귀하는 현재 보건복지부에 등록된 장애인입니까? (1=예, 2=아니오)
형식: {"dis_reg": {"1": .., "2": ..}}
The following is a complete short C1 measurement request body reconstructed from exp3.py and orclient.py, not a saved HTTP transcript. It excludes authentication and the usage-accounting field. The endpoint was OpenRouter's chat-completions endpoint. The requested model was deepseek/deepseek-v4.1-flash; the saved served-model identifier was deepseek/deepseek-v4.1-flash-1017.
{
  "model": "deepseek/deepseek-v4.1-flash",
  "temperature": 1.0,
  "max_tokens": 6,
  "reasoning": {"enabled": false},
  "logprobs": true,
  "top_logprobs": 20,
  "provider": {"only": ["deepseek"], "allow_fallbacks": false, "require_parameters": true},
  "messages": [
    {"role": "system", "content": "당신은 한국에 살고 있는 만 19세 이상 성인입니다.\n\n해당 인물로서 다음 설문 문항들에 솔직하게 답변하세요."},
    {"role": "user", "content": "귀하는 현재 보건복지부에 등록된 장애인입니까? (1=예, 2=아니오) 보기 번호 하나만 숫자로 답하세요."}
  ]
}
| A configuration | deepseek | glm | mistral |
|---|---|---|---|
| Fixed provider route | deepseek | morph/fp8 | mistral/zdr |
| Statement temperature / token cap | 0 / 500 | 0 / 2000 | 0 / 500 |
| Numeric-answer temperature / token cap | 1 / 6 | 0 / 1506 | 0 / 6 |
| Reasoning | disabled | effort low | disabled |
| Top logprobs | 20 | 20 | 20 |
| Primary repetitions of each persona-free statement | 5 | 30 | 30 |
| Primary C1 repetitions | 3 | 60 | 3 |
| Statement repetitions, each P0 wording variant | 3 | 5 | 5 |
| Numeric repetitions, each P0 wording variant | 3 | 10 | 3 |
All three routes disabled fallback; numeric-answer logprob requests additionally required parameter support. C2 covered 1,000 personas × three models × seven items: the five common questions plus two birth-month controls. E2c covered 1,000 × three × the two primary items, registered disability and sexual orientation. qwen was not part of A. GLM's C2 remeasurement selected the 50 personas with the largest sum of minority probabilities plus 50 randomly selected from the remainder, using seed 20261022, and remeasured both primary items. Those repeated values enter the uncertainty analysis rather than being silently treated as 100 additional people.
P0 used three wordings, including the primary wording. To make the two additional variants inspectable, these are the literal replacement system openings and statement leads from exp3.py; the final system instruction and JSON-only instruction remain unchanged:
C1_OPENINGS = [
    "당신은 한국에 살고 있는 만 19세 이상 성인입니다.",
    "당신은 대한민국에 거주하는 성인(만 19세 이상)입니다.",
    "당신은 한국에 사는 한 명의 성인(만 19세 이상)입니다.",
]
BASE1_LEADS = [
    "한국에 사는 만 19세 이상 성인 전체를 기준으로, 다음 문항에 대한 응답 분포(%)를 추정하세요. 확률의 합은 100입니다.",
    "대한민국에 거주하는 성인(만 19세 이상) 모두가 다음 문항에 답한다면, 각 보기를 고르는 사람의 비율(%)을 추정하세요. 비율의 합은 100입니다.",
    "한국 성인 인구(만 19세 이상)에서 다음 문항의 각 보기에 해당하는 사람이 몇 %인지 추정하세요. 비율의 합은 100입니다.",
]
C1V_LEADS = [
    "다음 설문 문항에 대해, 이 인물이 각 보기를 고를 확률(%)을 추정하세요. 확률의 합은 100입니다.",
    "다음 설문 문항에서 이 사람이 각 보기를 선택할 가능성(%)을 추정하세요. 가능성의 합은 100입니다.",
    "이 사람이 다음 문항의 각 보기를 고를 확률을 %로 추정하세요. 확률의 합은 100입니다.",
]
C1r retained the primary C1 repetition counts but replaced its system message with a randomly selected adult framing:
당신은 한국에 사는 만 19세 이상 성인 가운데 무작위로 뽑힌 한 사람입니다.

해당 인물로서 다음 설문 문항들에 솔직하게 답변하세요.
The two P2 controls asked about December and February births. They use the same numeric-only suffix as C1 when measuring token probabilities:
귀하는 12월에 태어났습니까? (1=예, 2=아니오)
귀하는 2월에 태어났습니까? (1=예, 2=아니오)
From an actual top-k record to an expected count
One saved primary C1 response was 2. These are the two option entries extracted from its full top-20 list, not the entire returned candidate list:
[["2", -0.0009613183], ["1", -7.096895]]
The following standalone Python uses only the standard library and needs no API or private data. It exponentiates the two logprobs, adds their mass, and normalizes within the answer options:
from math import exp

p_yes = exp(-7.096895)
p_no = exp(-0.0009613183)
option_mass = p_yes + p_no
normalized_yes = p_yes / option_mass
print(option_mass)
print(normalized_yes)
print(1000 * normalized_yes)
Its stdout is:
0.9998668144740093
0.0008277811040628272
0.8277811040628272
The final value is the expected count per 1,000 for this single call, not the primary three-repetition mean of 0.91 in the result table. The three actual retained probabilities bridge that example to the reported aggregate:
p = [0.0008277811040628272, 0.0010816820242030654, 0.0008277811040628272]
print(1000 * sum(p) / len(p))
0.9124147441095732
Rounding this three-call mean to two decimal places gives 0.91.
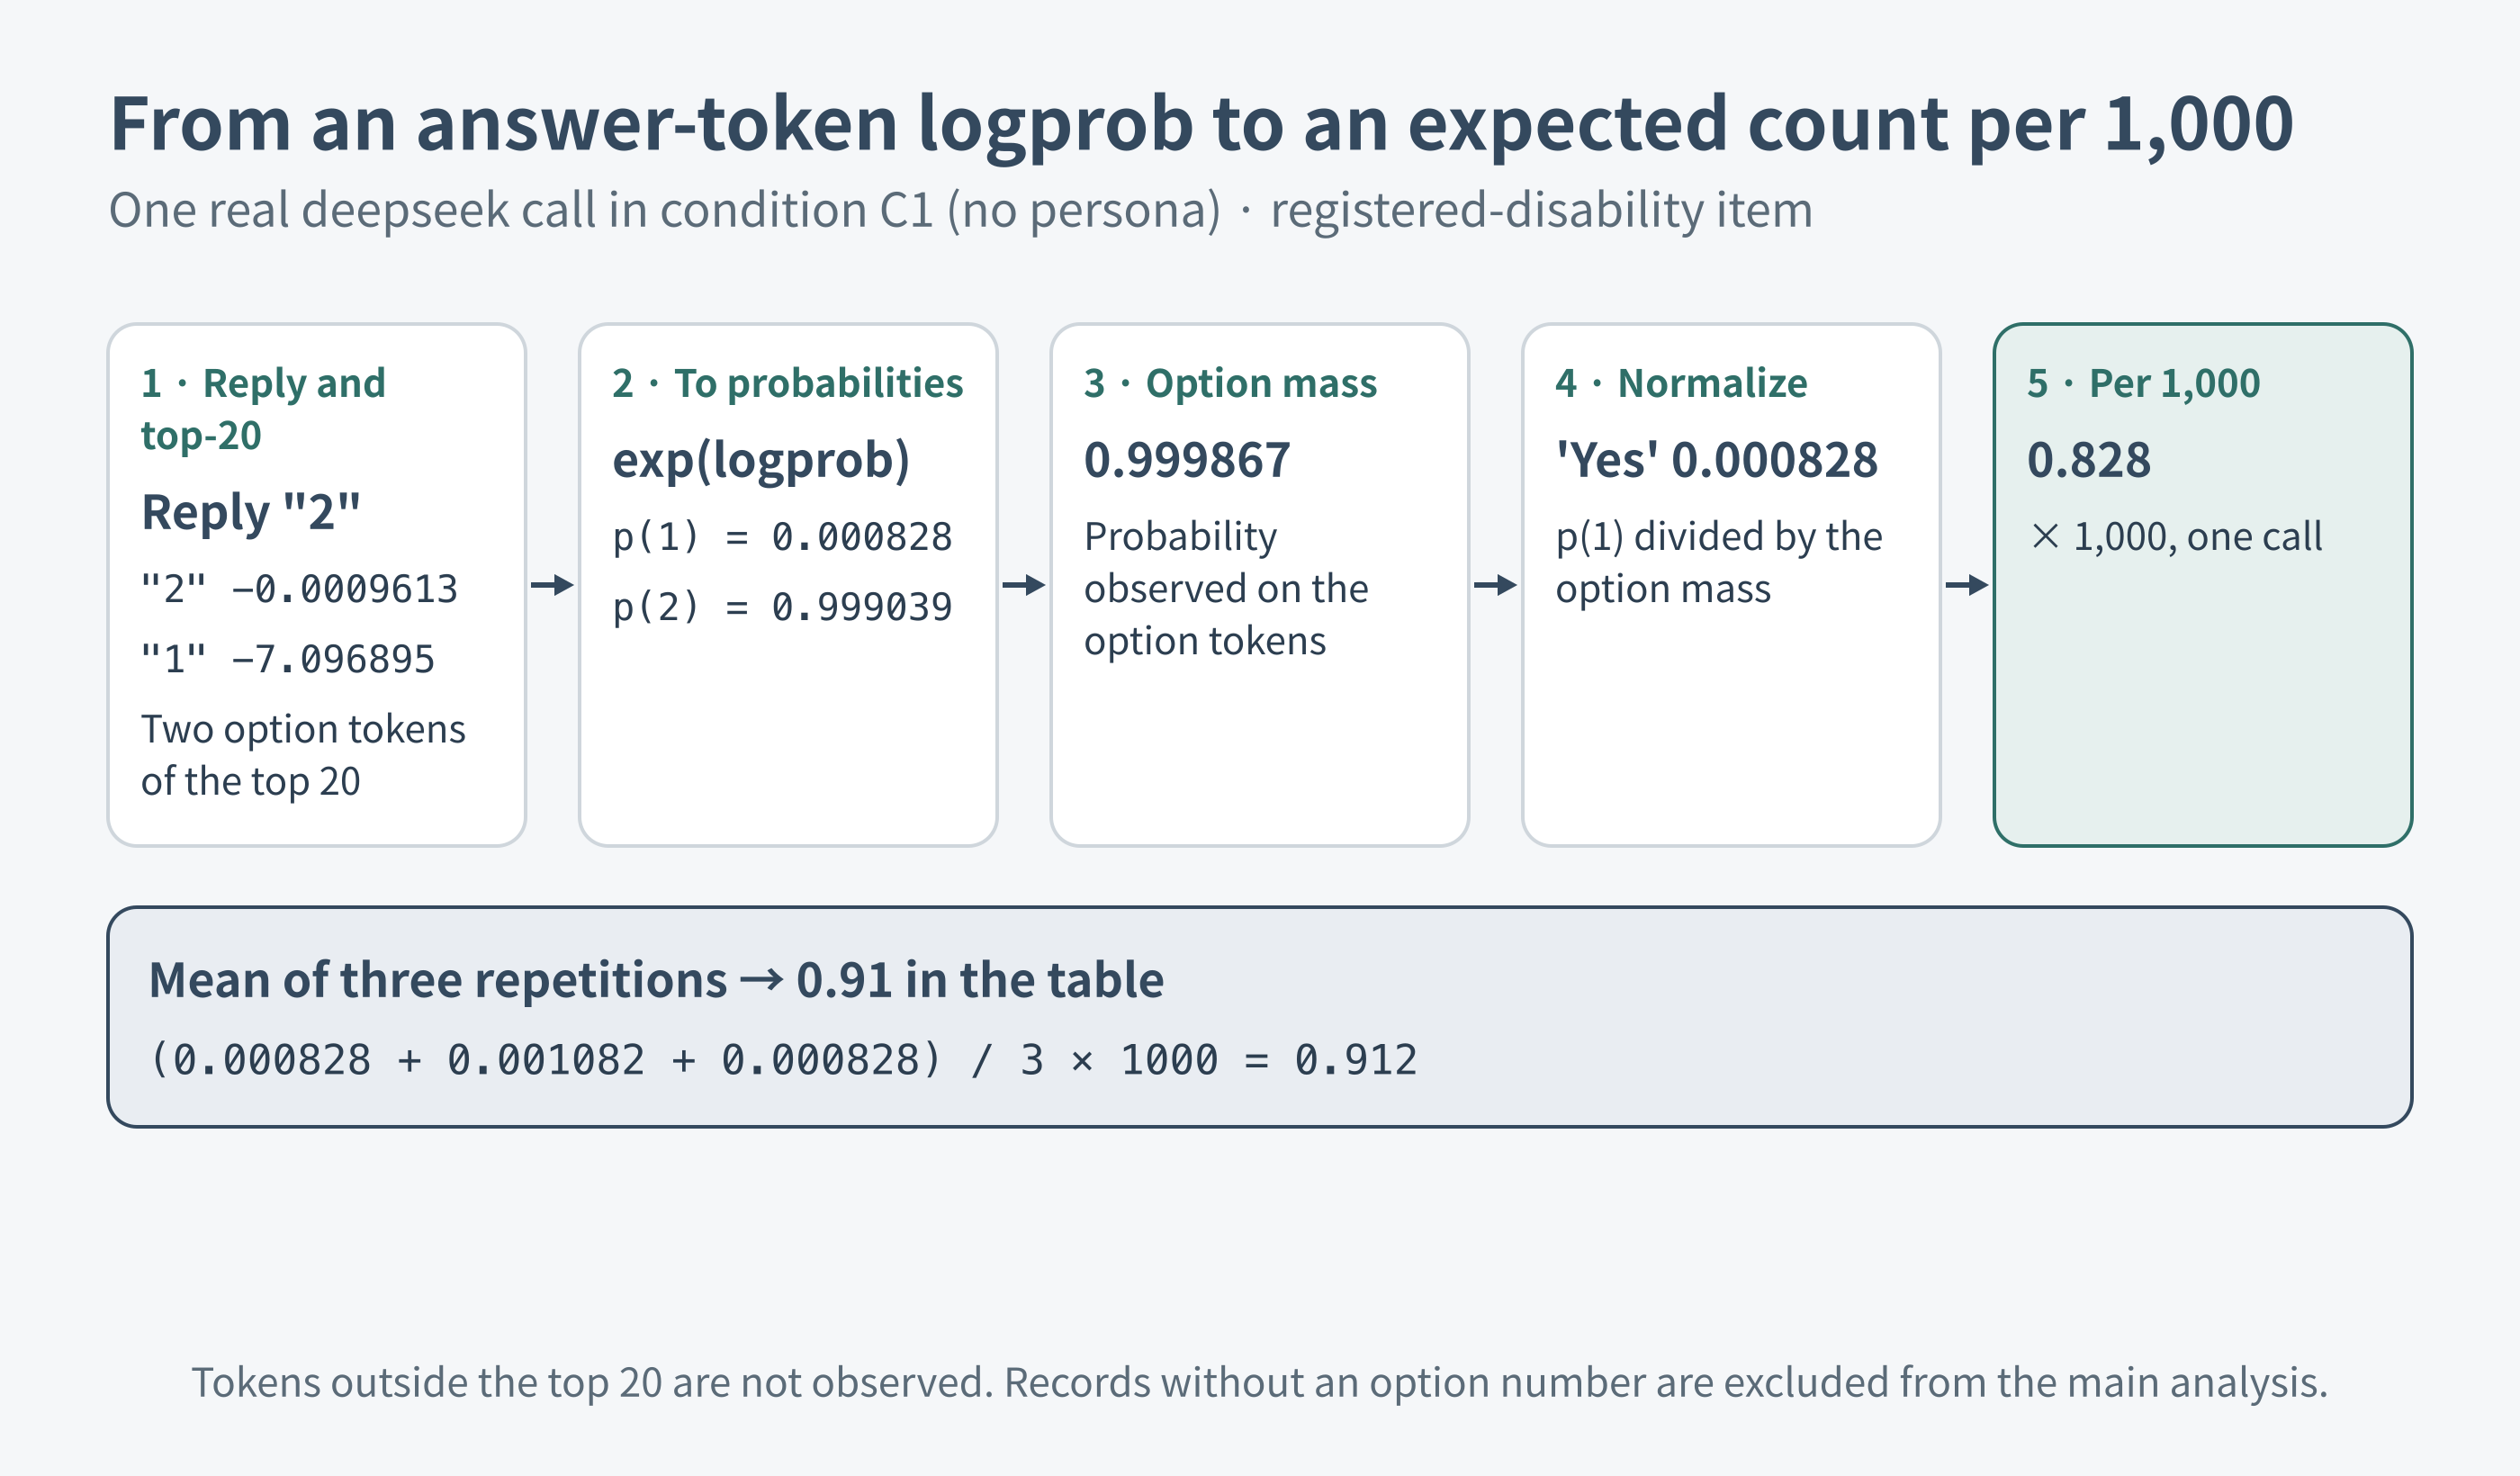
Figure 8. From an answer-token logprob to the table's unit. In one real C1 call, the logprobs of the two option tokens are converted to probabilities, normalized within the options, and scaled to 1,000 people. The mean of three repetitions is the 0.91 in the table.
Position selection matters before this calculation. exp3.parse_lp3 looks for the first generated token whose stripped text is a valid option number anywhere in the token sequence. It is not a first-character test. If no such token exists, it temporarily inspects the first logprob position and marks first_not_option=True. The following executable helper is a simplified reimplementation of that parser's probability path, not an API client:
from math import exp

def option_distribution(lp, options):
    if not lp:
        return None
    valid = {str(a): a for a in options}
    pos = next((e for e in lp if e["token"].strip() in valid), None)
    first_not_option = pos is None
    if pos is None:
        pos = lp[0]
    top = {t["token"]: t["logprob"] for t in pos.get("top_logprobs", [])}
    if pos["token"] not in top:
        return None
    p = {}
    for token, logp in top.items():
        answer = valid.get(token.strip())
        if answer is not None:
            p[answer] = p.get(answer, 0.0) + exp(logp)
    mass = sum(p.values())
    probs = {a: p.get(a, 0.0) / mass for a in options} if mass > 0 else None
    return {"probs": probs, "mass": mass, "first_not_option": first_not_option}
Whitespace variants mapping to the same number contribute to the same option. Top-k omissions are unobserved, not proven zeros. In the main analyses, a non-option flag is an exclusion even if the fallback position yields a normalized vector. Zero-imputing those responses is a separate sensitivity analysis, not part of normalization. After selecting valid, latest records, the aggregation is:
def expected_per_1000(valid_distributions, item):
    minority = (2, 3) if item == "orient" else ((2,) if item == "birth" else (1,))
    values = [sum(p.get(a, 0.0) for a in minority) for p in valid_distributions]
    return 1000 * sum(values) / len(values) if values else None
This explanatory helper uses integer keys; the actual loaders accommodate the string keys in stored JSON. It is an expectation from probabilities, not E1's count of generated option numbers.
Aggregate contrasts
The request body, provider table, repetition counts, code, and position-selection examples above specify the deepseek, glm, and mistral configurations. Gemma has separate settings described in the methods subsection. The tables compare five models under the same task definitions, with the model-specific settings and valid denominators kept distinct.
The five-model comparison measures both primary items under five tasks, from a population statement to a response using a full persona. Each condition is an independent call. The horizontal axis orders the prompt comparisons. It does not trace an internal probability through a causal chain.
Here the unit N = 1,000 × mean(v or p) is an operational score per 1,000: v is a stated probability expressed as a fraction, and p is the returned answer-token score normalized within the available numeric options. Persona-free tasks average repeated calls; C2 and E2c average 1,000 personas. N does not estimate how many minority answers temperature-0 decoding will generate. The selected options, g, are a separate observation.
The tables compare five models on both primary items. BASE1 is the one-item population statement, C1v the one-person probability statement without a persona, C1 the numeric answer without a persona, C2 the numeric answer with structured fields, and E2c the numeric answer with the full narrative. BASE, which bundles five questions, is a separate condition.
Registered disability
| Model | BASE1 | C1v | C1 | C2 | E2c |
|---|---|---|---|---|---|
| deepseek | 51 | 50 | 0.9124 | 0.3583 | 0.07666 |
| glm | 57.43 | 46.67 | 24.54 | 2.824 | 4.763 |
| mistral | 55.93 | 22 | 4.853e-05 | 0.03351 | 1 |
| gemma3 | 50.2 | 50 | 0.05829 | 1.447 | 0.0002657 |
| gemma4 | 52 | 50 | 0† | 6.772e-08 | 0† |
Sexual orientation: gay/lesbian or bisexual
| Model | BASE1 | C1v | C1 | C2 | E2c |
|---|---|---|---|---|---|
| deepseek | 60 | 50 | 0.8467 | 0.2826 | 1.371 |
| glm | 34.63 | 55.67 | 79.48 | 3.039 | 6.732 |
| mistral | 66.83 | 80.67 | — | 10.86 | 8.078 |
| gemma3 | 34.8 | 200 | 0.009401 | 0.004223 | 2 |
| gemma4 | 40 | 40 | 1.481e-06 | 1.595e-07 | 4.955e-08 |
These two comparison tables are rounded to about four significant figures; the plot uses the original aggregates. The returned-candidate-only normalization is called the legacy point estimate below. Here “legacy” names the mass-normalization rule, not a different sample.
The dash marks the mistral sexual-orientation refusal, not a zero. A dagger (†) marks a legacy displayed zero whose minority-option mass was unobserved in the returned candidates. Neither symbol is replaced by a positive floor for plotting.
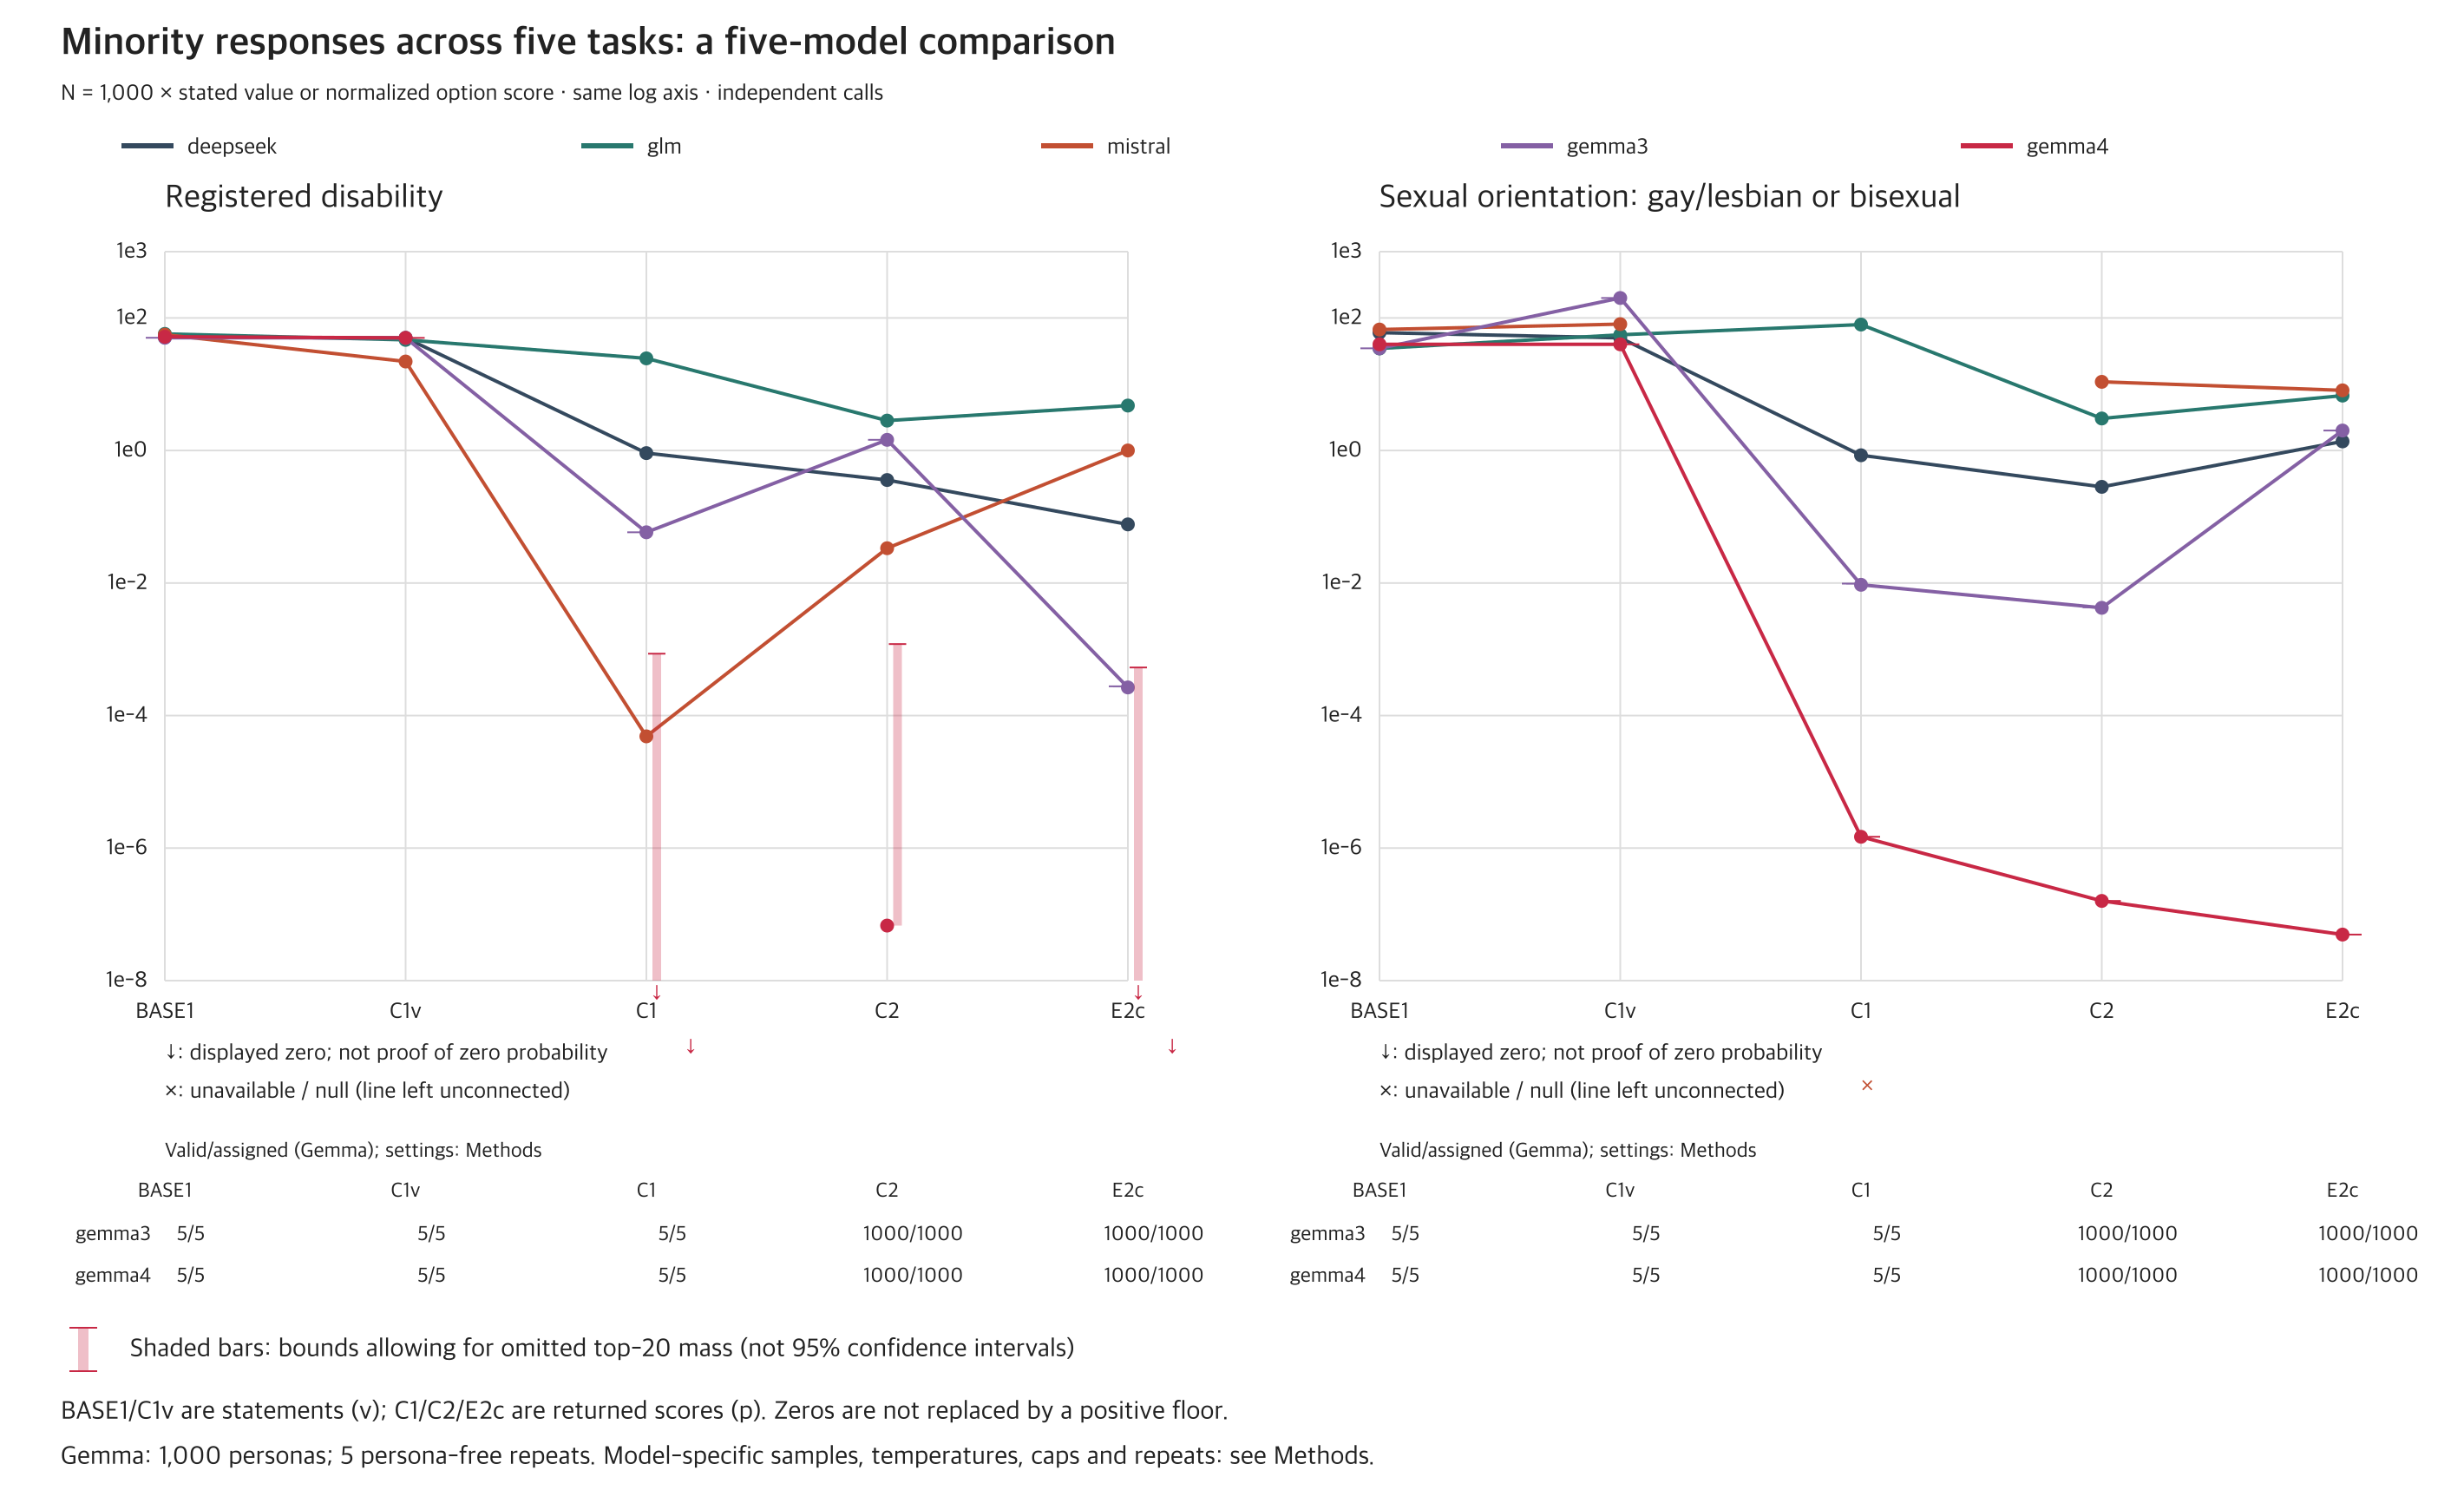
Figure 9. Both primary items and all five models on the same log-axis comparison. Click either figure for full resolution. Points and connecting lines show the operational normalized scores in the tables. Pink whiskers show conservative ranges from unreturned top-k mass for the Gemma measurements; they are not 95% confidence intervals. A zero is shown as a censored marker outside the log scale, while a missing measurement breaks the line. Collection dates, temperatures, output caps, repetition counts, and the precision documented for each serving route differ across model configurations, so this is not a controlled model ranking.
For registered disability, deepseek and mistral already have a large gap before persona information is added. The Gemma 3 measurements do not follow a monotone decline: C1 is 0.05829, C2 rises to 1.447, and E2c falls to 0.0002657. The C2 score is higher than C1 in this comparison; the narrative condition has a lower value.
For sexual orientation, Gemma 3 moves from C2 = 0.004223 to E2c ≈ 2. Its increase when narratives are included contrasts with its registered-disability result. glm also rises from C2 to E2c in both items. A single declining curve or a single stage of erasure cannot describe every model and item. These reversals identify contrasts worth investigating without establishing which part of the input caused them.
Gemma 4's numeric-answer scores are very small in both items, but displayed zeros do not establish true zero probability. For registered disability, the C1 normalized-mass range extends from 0 to approximately 0.00085819 per 1,000; the E2c range extends from 0 to approximately 0.000531557. Its C2 point is approximately 6.77219e-8, while the upper bound is approximately 0.00119896 per 1,000. The point describes the returned option mass; the bound also allows for mass the API did not return. It addresses that incomplete-token-information uncertainty, not the full uncertainty from persona sampling, errors in stated probabilities, or every source of serving variation.
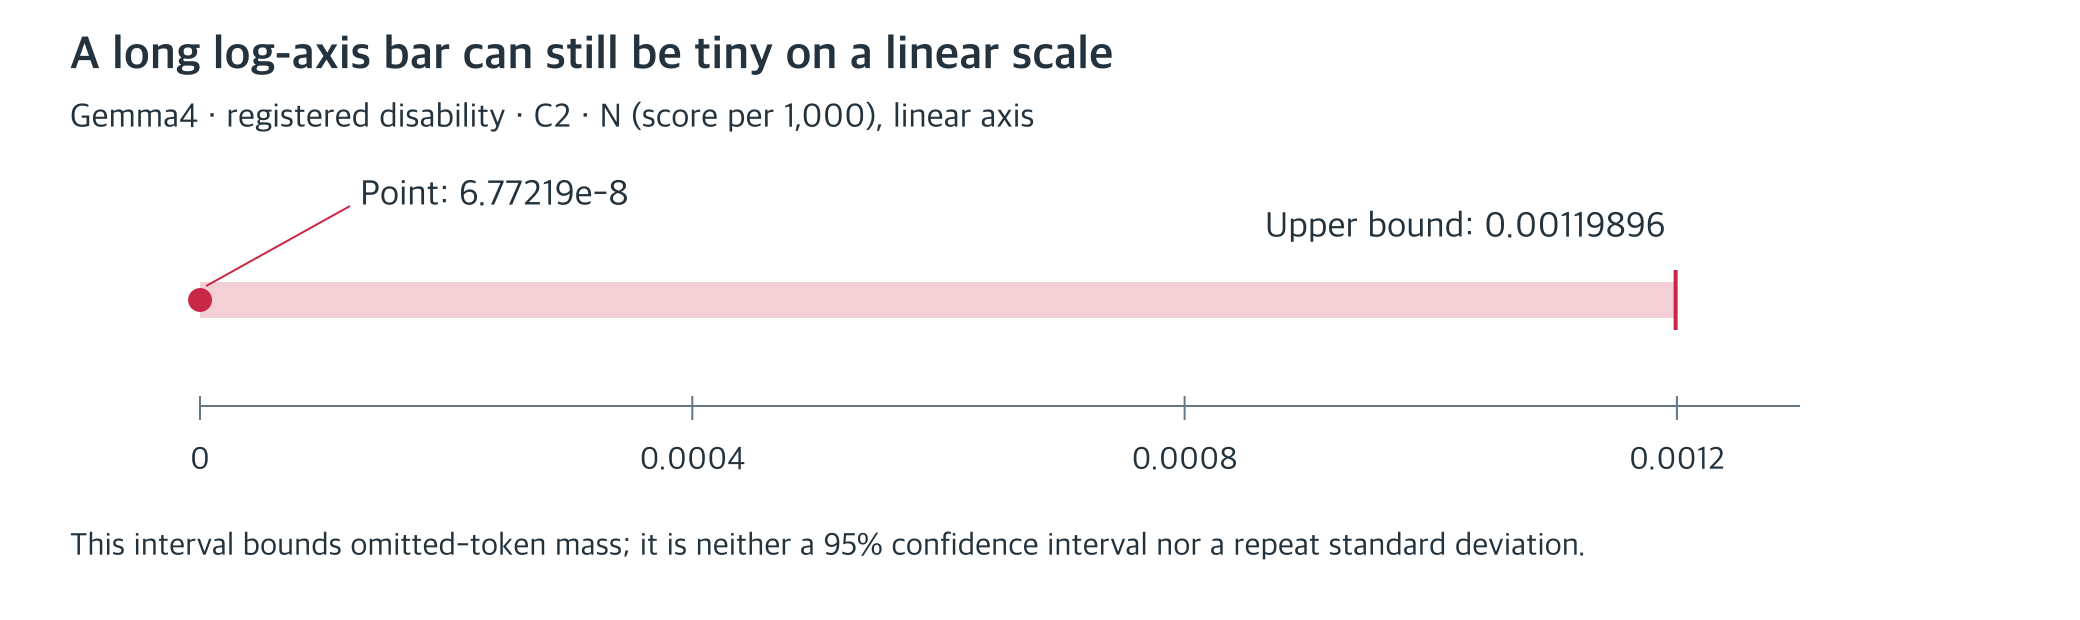
Figure 9a. The Gemma 4 C2 example enlarged on a linear axis. The point, approximately 6.77219e-8 per 1,000, normalizes only returned numeric-option mass. The upper bound, approximately 0.00119896, allows unreturned mass to belong to minority-option tokens. The pink range is a bound from incomplete token information, not a confidence interval or a claim that all values within the range are equally likely.
Another complication arose with glm: some calls skipped reasoning and answered directly, and these calls strongly influenced the average minority probability. Their frequency differed by condition, and changing the wording shifted the results. This suggests a hypothesis that reasoning could suppress minority responses, but reasoning was not randomly assigned. Observing an association between a reasoning path and an output is not the same as establishing that reasoning caused the change.
I also examined rarity itself. Compared with questions about being born in December or February—relatively uncommon categories without the same stigmatized attributes—deepseek showed larger log-odds decreases for minority-identity questions. mistral also gave extremely small birth-month probabilities, but a measurement floor prevented the same judgment. This comparison probes whether rarity alone is sufficient; it does not causally disentangle rarity from stigma.
Changing the wording to “one person randomly selected from South Korean adults” did little to restore deepseek's or mistral's answer-token probabilities. That does not establish the absence of a process that selects a typical person. The observation is narrower: this wording change did not substantially change the output.
Nor does the table absolve the dataset. Once a value is near zero, there is little absolute room for an additional decrease after adding a narrative. A small absolute change is therefore not evidence that data composition matters little. These are output contrasts between specified conditions, not percentages allocating historical responsibility between data generation and model training.
Result 3. Multi-turn conversations confirmed scarcity, but the effect of writing reasons remains unresolved
What was carried through the nine rounds
The MT reconstruction distinguishes 31 top-level questions from 51 actual answer slots. Composite scales account for the difference:
| Round | Bundle and contents | Top-level questions | Answer slots |
|---|---|---|---|
| 1 | Minority identities: birth, self-reported and registered disability, orientation, transgender status | 5 | 5 |
| 2 | Childhood: parental death, divorce, school dropout, care by relatives | 4 | 4 |
| 3 | Economic: food insecurity, utility arrears | 2 | 2 |
| 4 | Spousal violence: verbal abuse, threats, physical violence | 3 | 3 |
| 5 | Relationships: family, spouse, children | 3 | 3 |
| 6 | Chronic health: self-rated health, EQ-5D, hypertension, diabetes | 4 | 8 |
| 7 | Mental health: PHQ-9, GAD-7, suicidal ideation, plans, attempts | 5 | 19 |
| 8 | Behavior: smoking, drinking, strength training | 3 | 5 |
| 9 | Unmet care: general and dental | 2 | 2 |
| Total | Nine sequential bundles | 31 | 51 |
EQ-5D expands to five slots, PHQ-9 to nine, GAD-7 to seven, and smoking and drinking to two each: 31 + 4 + 8 + 6 + 1 + 1 = 51. The primary order used the first 200 personas for each of nine models. In mt_rev, the minority bundle moved to the end while the other bundles retained their order; this covered the first 100 personas for glm, mistral, and qwen. Some source questions retained their literal 2024 reference period. Survey address forms were changed to 귀하, and non-applicability instructions were added. These choices do not establish an exact match to the original study's unpublished supplementary questionnaire.
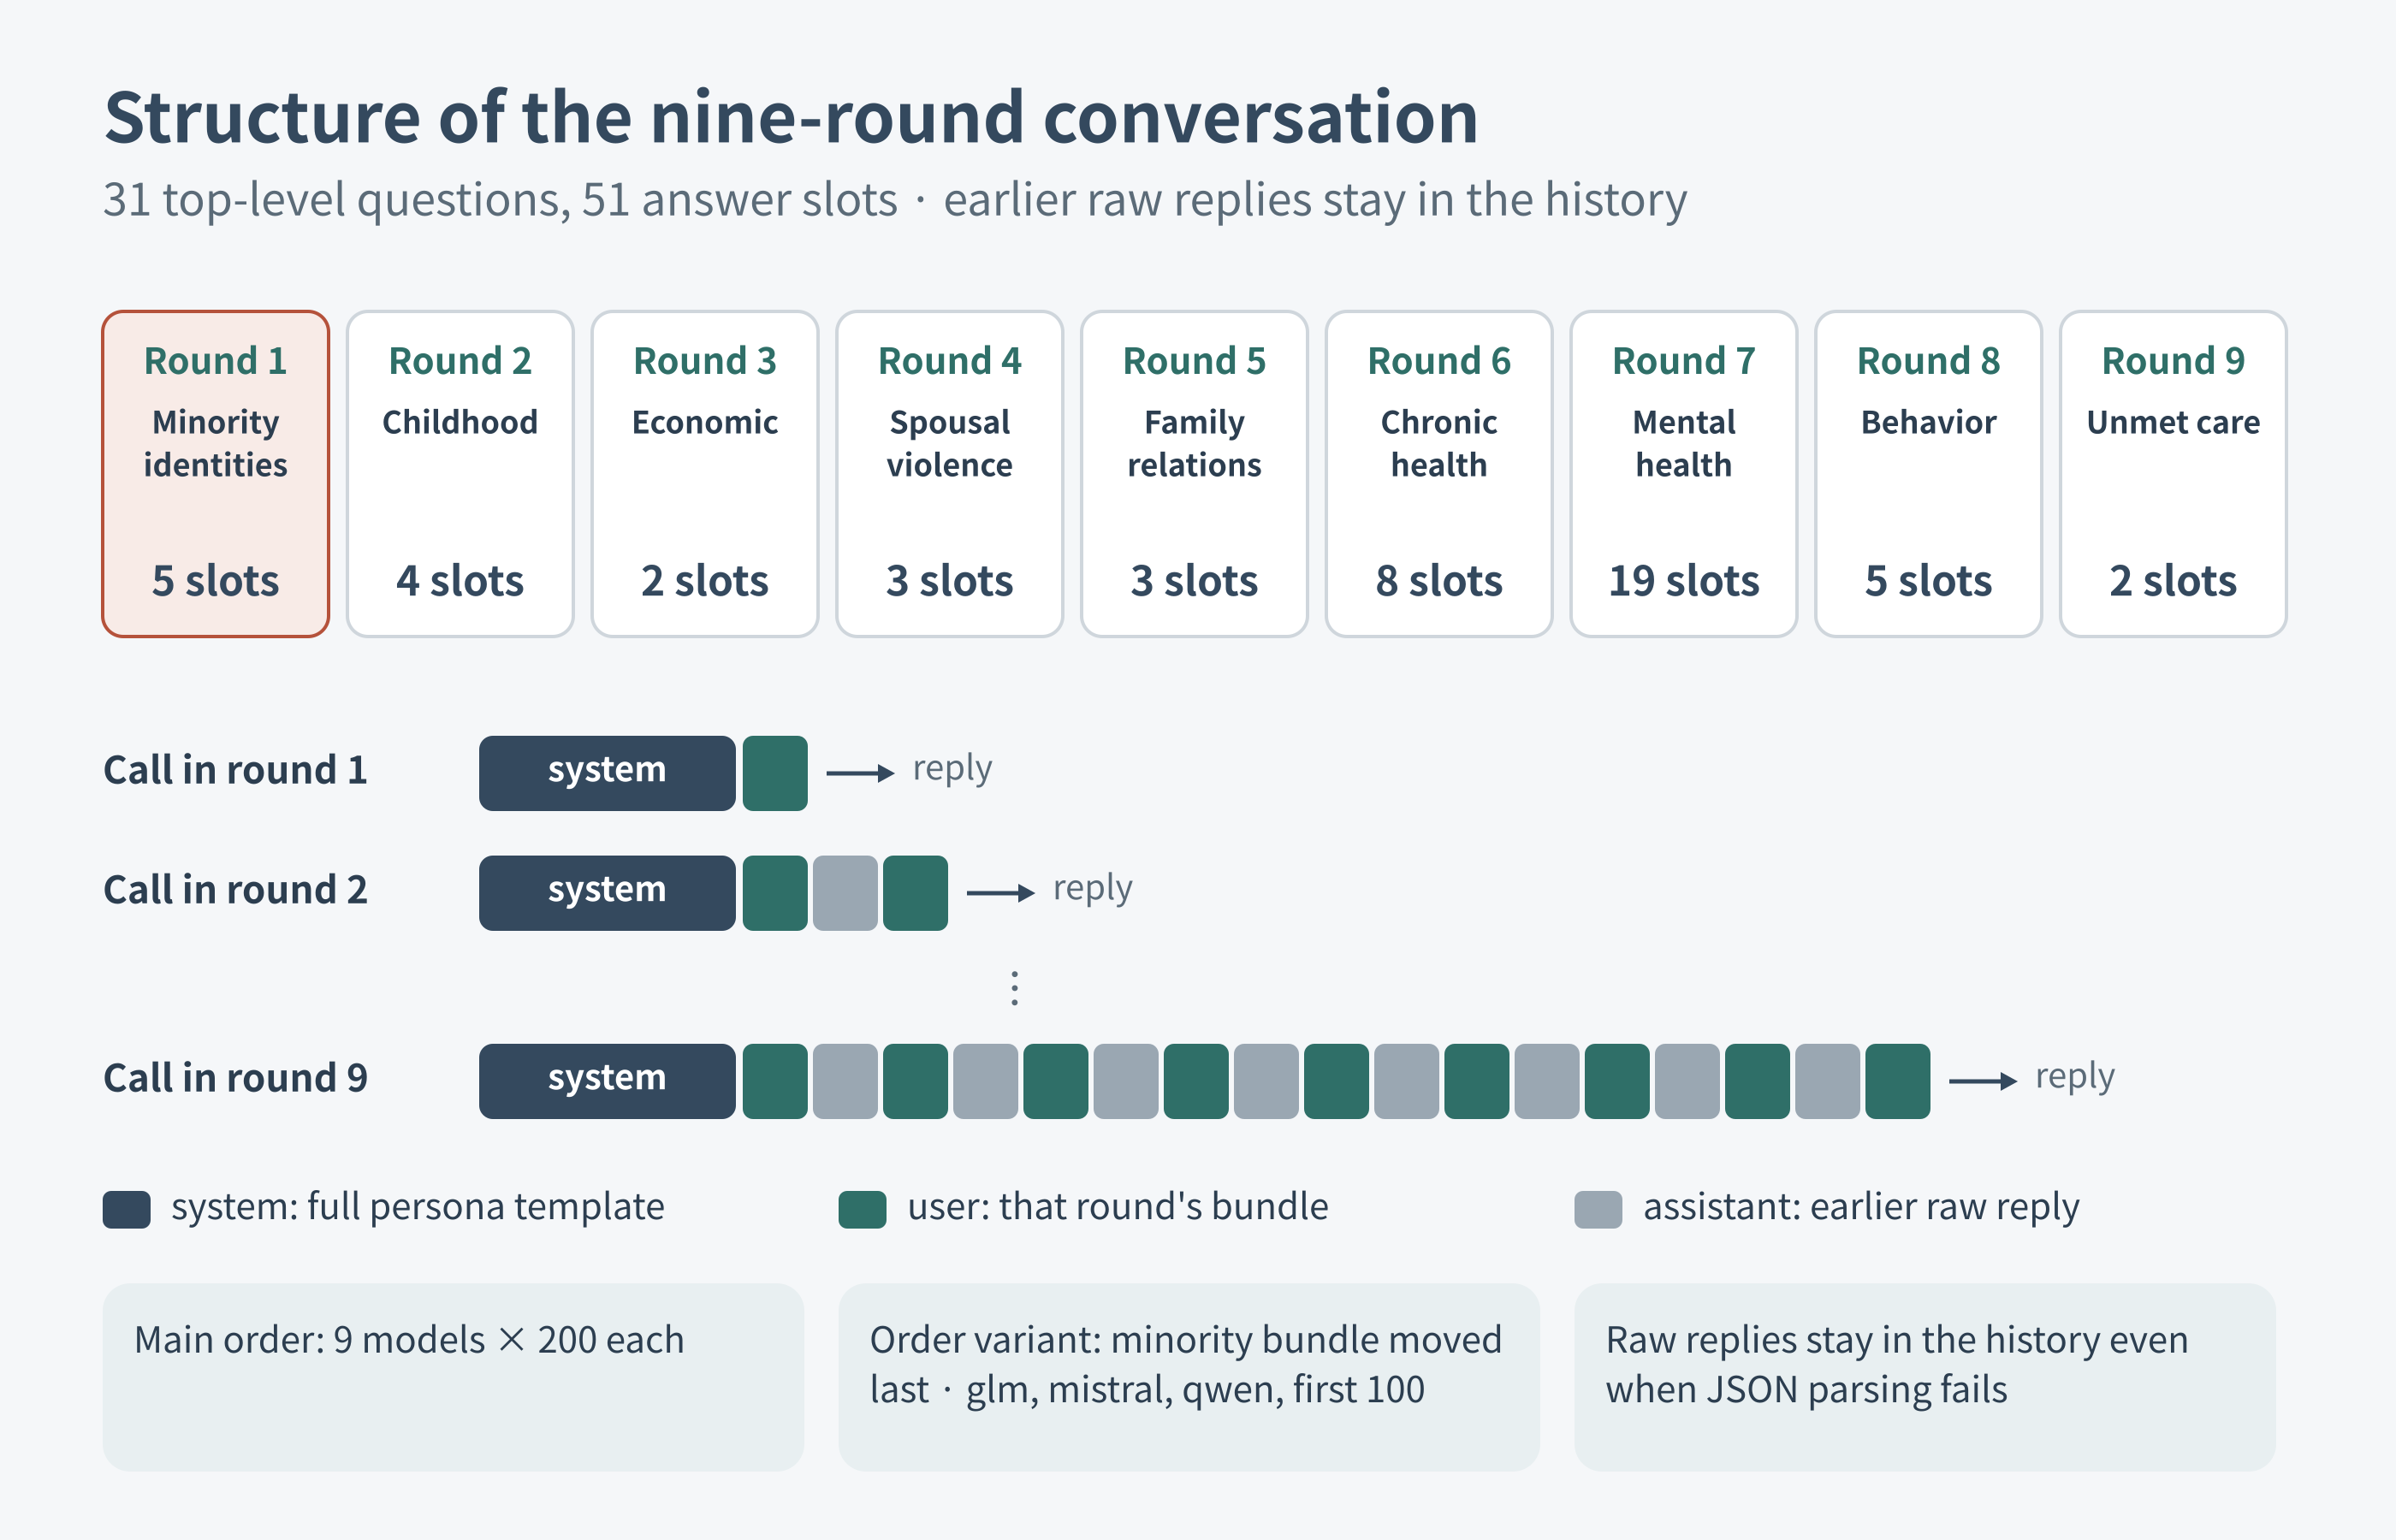
Figure 10. Structure of the nine-round conversation. Each round sends one bundle, and earlier raw replies accumulate in the next call's history. In the main order, the minority questions came in the first round, with no prior history.
The first MT user message uses the same five question lines given above, in the same order and with - prefixes. Its literal header adds an instruction for questions with subitems:
다음 설문 문항들에 해당 인물로서 답하세요. 각 문항마다 먼저 해당 인물로서 한국어 한 문장(50자 이내)으로 이유를 쓰고 보기 번호 하나를 고르세요. 하위 문항이 있는 문항은 이유를 한 번 쓰고 하위 문항마다 보기 번호를 고르세요. 다른 말 없이 JSON만 출력하세요.
The header, newline, five question lines, newline, and this literal format line form the complete first-round message:
형식: {"birth": {"reason": "...", "answer": 1}, "dis_self": {"reason": "...", "answer": 1}, "dis_reg": {"reason": "...", "answer": 1}, "orient": {"reason": "...", "answer": 1}, "trans": {"reason": "...", "answer": 1}}
The history update below is explanatory abbreviated code for mt.py, not a standalone client. call_model stands for the configured API call. The system contains the full persona, and the assistant content appended is the verbatim response, not parsed JSON serialized again:
messages = [{"role": "system", "content": system_message(persona)}]
for bundle in bundles:
    messages.append({"role": "user", "content": user_message(bundle)})
    response = call_model(messages)
    messages.append({"role": "assistant", "content": response["content"]})
A parse failure was a final response: its text entered the history and the next round continued. An error with no response normally stopped that conversation. The qwen stopping-rule departure is disclosed below rather than being hidden in this abbreviated loop.
| MT model | Temperature sent | Token cap | Reasoning setting | Top-k logprobs |
|---|---|---|---|---|
| haiku | omitted | 3000 | off | none |
| luna | omitted | 3000 | off | none |
| deepseek | 0 | 3000 | off | none |
| qwen | 0 | 3000 | off | 5 |
| mistral | 0 | 3000 | off | 20 |
| glm | 0 | 4500 | low | 20 |
| solar | 0 | 3000 | off | none |
| llama | 0 | 3000 | reasoning field omitted | 20 |
| gemini, final direct Batch path | omitted | 4500 | thinking level low | none |
The fixed OpenRouter provider allowlists were anthropic for Haiku, openai/flex for Luna, deepseek for DeepSeek, ["alibaba", "alibaba/us-east-1"] for Qwen, mistral/zdr for Mistral, morph/fp8 for GLM, upstage/zdr for Solar, and parasail/fp8 for Llama. The common-input Gemini route was google-vertex/global/flex, distinct from its final MT path described below. OpenRouter calls disabled provider fallback; logprob routes required parameter support. Conversations used a fixed session identifier and a 240-second timeout, with ephemeral cache control on the Anthropic path. After schema rejection in the pilot, the entire main run used JSON requested in prompt text: this was not a per-response schema fallback. The final Gemini analysis excluded the OpenRouter records and added 200 conversations through Gemini Developer Batch, using gemini-3.8-flash, max_output_tokens=4500, and thinking_level=low, with temperature and schema omitted. That client uses system_instruction and contents with the model role and carries forward only response text, excluding thought parts. Thus its execution path differs from the originally registered OpenRouter path.
Here is a registered-disability excerpt from an actual first-round mistral response, whose complete JSON was wrapped in a code fence:
{"dis_reg":{"reason":"장애인이 아니니 당연히 등록되어 있지 않습니다.","answer":2}}
At its answer position, the saved top-20 list included 2: -0.00001490105023549404 and 1: -11.125015258789062. Those are two entries, not the whole top-k list. Normalization gave minority probability 0.000014738976701867465 with option mass 0.9999998380350993; the saved alignment mode was token_text. Generating option 2 therefore did not mean that the probability of option 1 was exactly zero.
A one-item contrast for format and reason writing
B1 compared the first 200 personas, three models, two items, and two reason/format conditions: 200 × 3 × 2 × 2 = 2,400 records. Its primary numeric anchor was E2c, not the common-input E2. E2c and B1 were measured on different dates; date variation is part of the contrast (see the methods metadata). B1n was a follow-up condition chosen after inspecting MT results. The following are the complete actual user messages for registered disability; each has the same full persona system message but no accumulated conversation history.
E2c, numeric-only:
귀하는 현재 보건복지부에 등록된 장애인입니까? (1=예, 2=아니오) 보기 번호 하나만 숫자로 답하세요.
B1n, answer-only JSON:
다음 설문 문항에 해당 인물로서 답하세요. 보기 번호 하나를 고르세요. 다른 말 없이 JSON만 출력하세요.
- dis_reg: 귀하는 현재 보건복지부에 등록된 장애인입니까? (1=예, 2=아니오)
형식: {"dis_reg": {"answer": 1}}
B1, reason then answer:
다음 설문 문항들에 해당 인물로서 답하세요. 각 문항마다 먼저 해당 인물로서 한국어 한 문장(50자 이내)으로 이유를 쓰고 보기 번호 하나를 고르세요. 하위 문항이 있는 문항은 이유를 한 번 쓰고 하위 문항마다 보기 번호를 고르세요. 다른 말 없이 JSON만 출력하세요.
- dis_reg: 귀하는 현재 보건복지부에 등록된 장애인입니까? (1=예, 2=아니오)
형식: {"dis_reg": {"reason": "...", "answer": 1}}
Although B1 contains only one question, it retains MT's plural wording and subitem instruction. The conditions therefore differ in more than the presence of a reason field.
| Condition | Probability position | Token cap: deepseek / glm / mistral |
|---|---|---|
| E2c | First generated valid option-number token | 6 / 1506 / 6 |
| B1n | Number after the item's JSON answer field | 30 / 1530 / 30 |
| B1 | Number after the item's JSON answer field | 500 / 2000 / 500 |
| MT first round | Each of five items' answer positions | 3000 / 4500 / 3000 |
E2c/B1n/B1 used temperature 1 for deepseek and 0 for glm/mistral, all with top-20 logprobs and the A experiment's off/low reasoning settings and fixed routes. MT instead used temperature 0 for deepseek. B1 requests were transmitted consecutively for caching but remained independent [system, user] calls; no previous answer was appended.
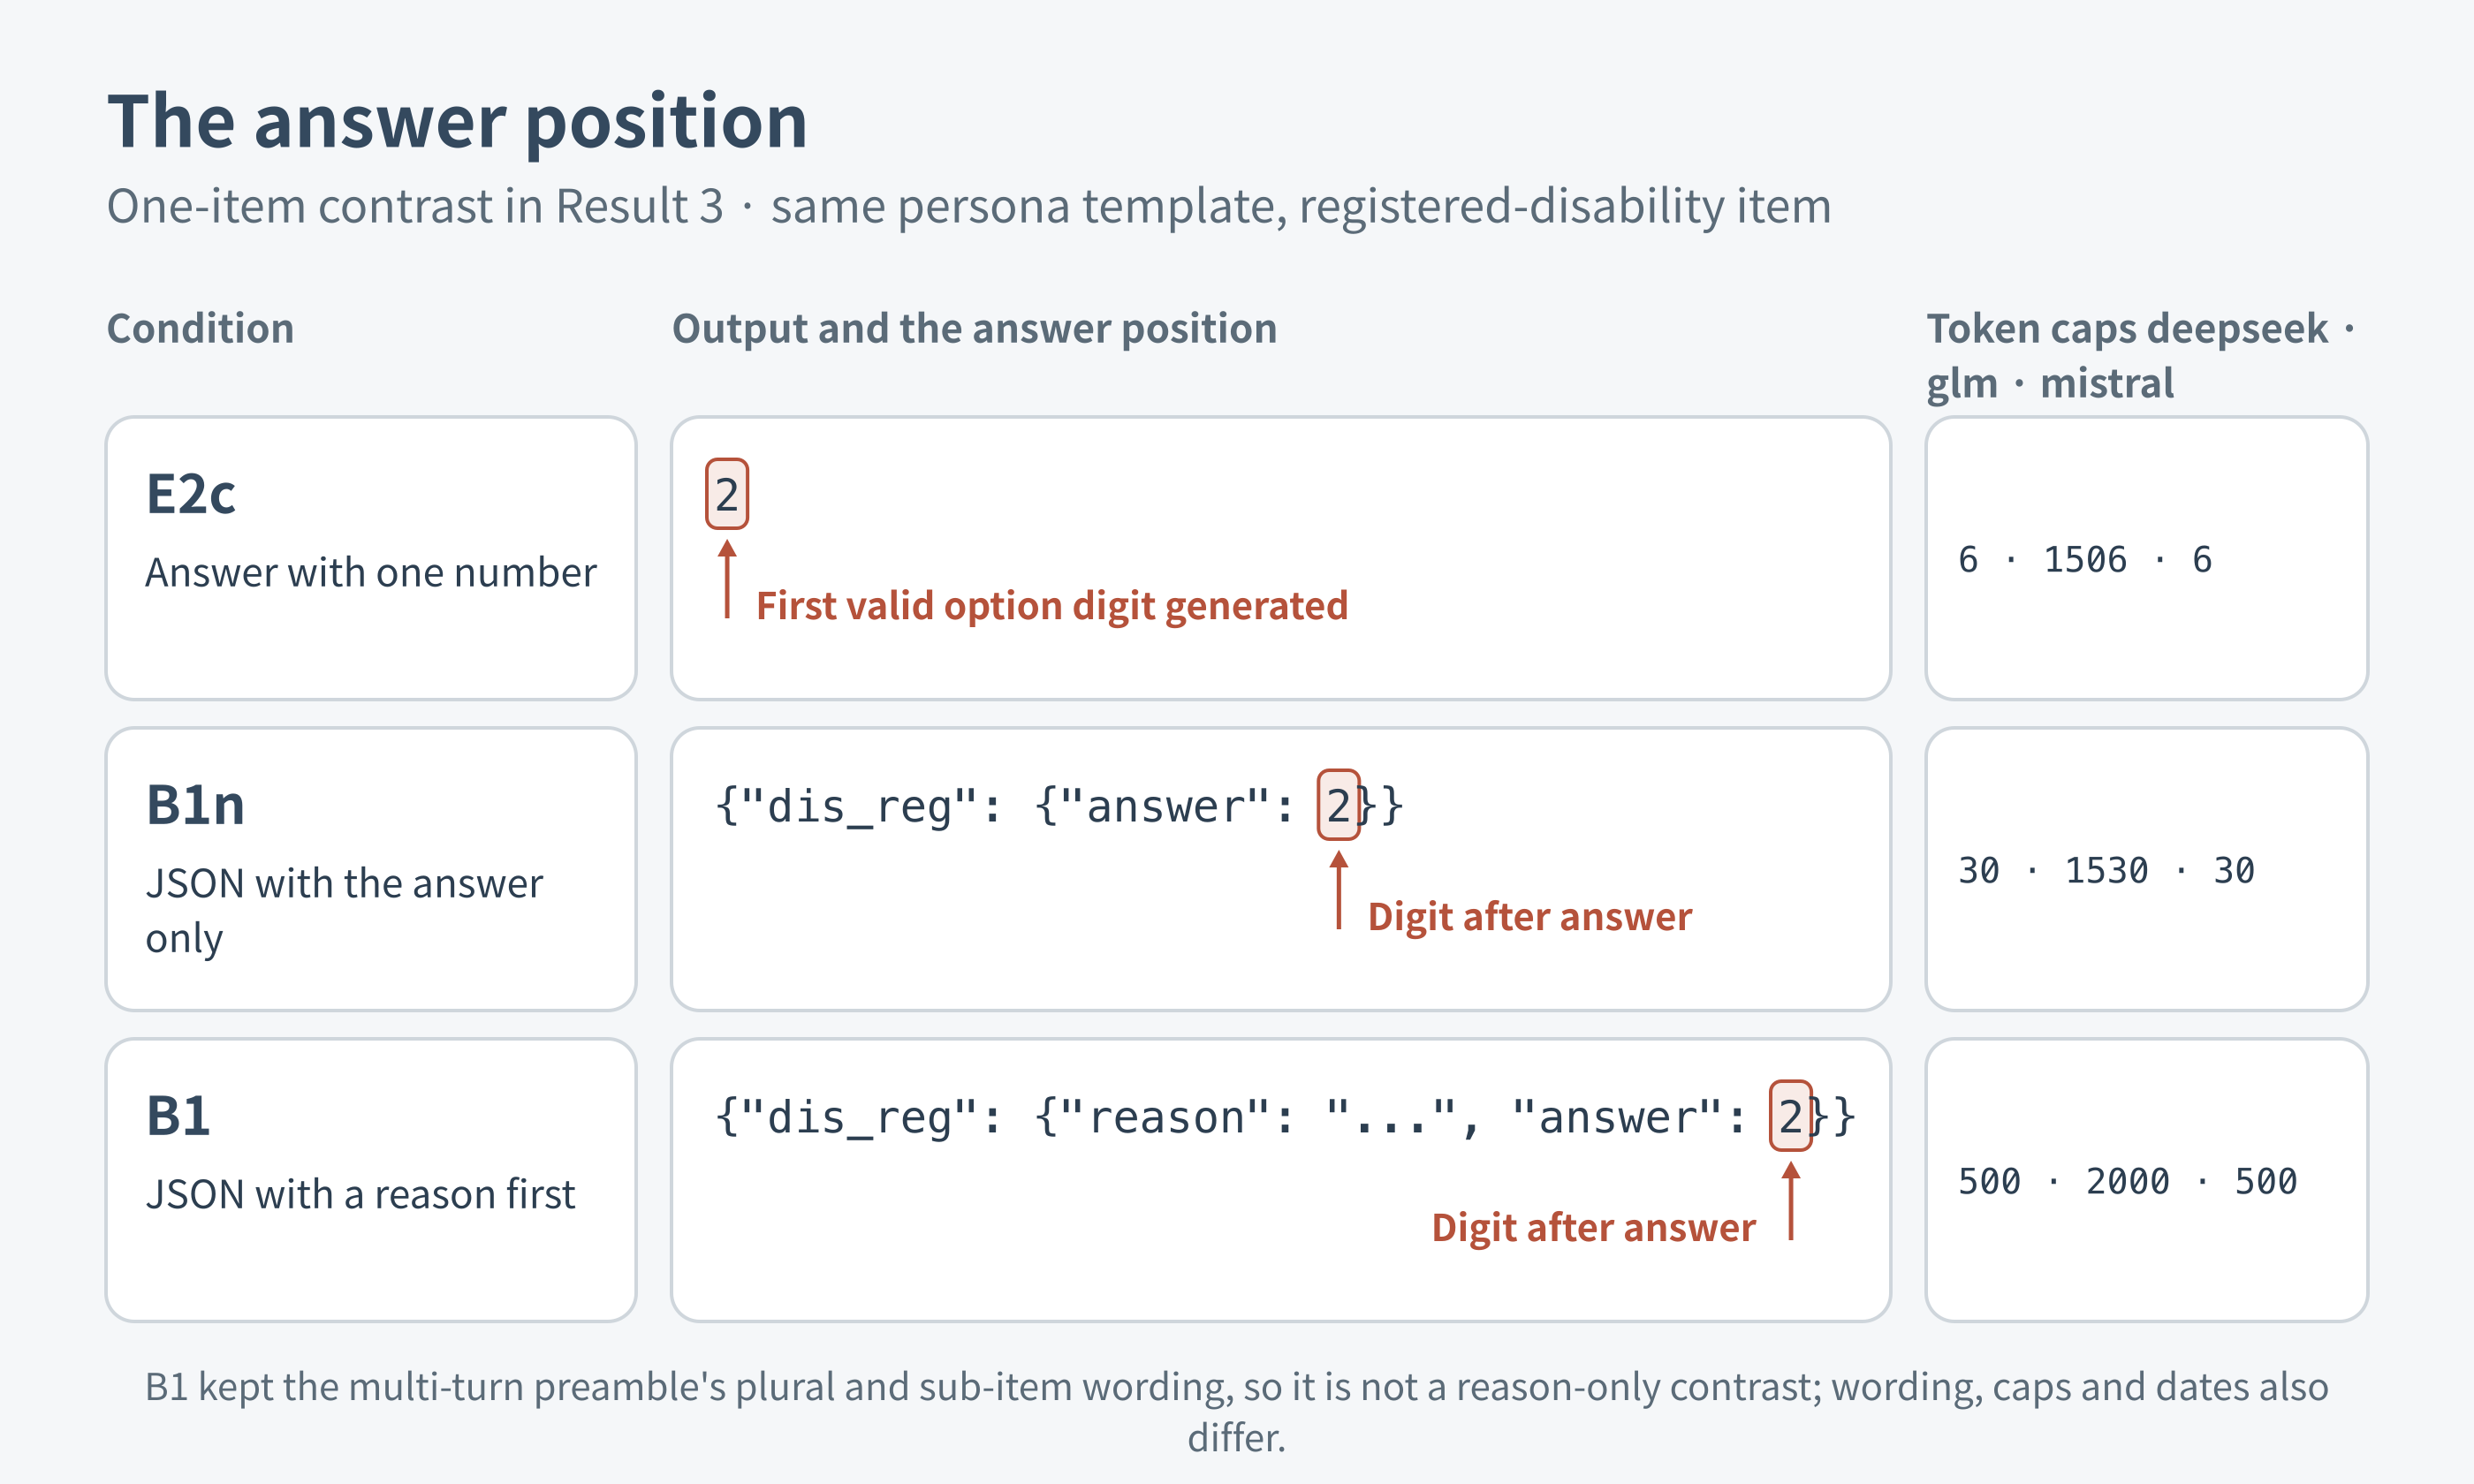
Figure 11. The answer position in the one-item contrast: the first valid option digit generated in E2c, and the digit after the item's answer field in B1n and B1. Probabilities are computed from the logprobs at this position. Wording, token caps, and measurement dates also differ.
An actual B1 mistral response contained the following JSON, originally inside a code fence:
{"dis_reg":{"reason":"수십 년간 설비 조작원으로 일하며 별다른 사고 없이 건강하게 일해왔고, 등록된 장애는 없습니다.","answer":2}}
Its answer-position minority probability was 4.993718453042893e-08, with mass 0.9999999307279057; option logprobs were 2: -1.1920928244535389e-07 and 1: -16.8125. This is not the same persona as the MT example and is not a before-and-after causal comparison. Both are output-format examples, not selected representative cases.
For MT/B1, first_json takes the text from the first opening brace through the last closing brace and parses it as JSON. parse_answers checks the first character of the answer string against the item's options. It does not require that the reason exist, have at most 50 characters, or precede the answer for an answer to count as valid. The logprob extractor separately locates the numeric character after that item's answer key and uses the token covering that position. If Korean token text fails to align with the response, it realigns against the concatenated token text and records token_text. A disagreement between the parsed answer and token, or a missing position, is recorded as a failure. This is not E2's first-option-token search.
B1n had 1,200 ok records. B1 had 1,183 ok and 17 parse failures: six deepseek and 11 glm. Each paired contrast uses its own valid-persona intersection; an additional four-condition common-set analysis checks sensitivity to those changing denominators. For example, mistral's orientation format contrast had 176 valid pairs, while its reason contrast had 200.
B1 used 2,000 paired bootstrap resamples, seed 20261024, with probabilities clipped to [1e-6, 1-1e-6] before logit calculation. Fewer than 50 pairs means insufficient data; both means below the floor means the contrast is not assessable. A decrease requires the upper CI bound for the logit difference to be at most -log(2) and an absolute expected-count difference of at least 1 per 1,000. An increase requires the lower bound to be at least log(2) and the same absolute-count threshold. A CI entirely inside the open interval (-log(2), log(2)) is classified as the same within the detection limits; all remaining assessable cases are borderline. These rules leave all six reason-stage comparisons borderline, not equivalent.
MT used a different bootstrap seed, 20261022, with 2,000 paired resamples and no B1-style minimum of 50. Generated-answer comparisons required both an exact two-sided McNemar p-value below .05 and an absolute proportion difference of at least .01. Social-suffering events included PHQ-9 sum ≥10, GAD-7 sum ≥8, and any EQ-5D dimension at level 2 or 3. Spousal items excluded personas without a spouse; family non-applicability option 0, unmet-care option 3, and designated unknown responses were removed from their respective denominators. This was not a new survey-standardized SPR analysis.
Observations and their limits
To examine responses under cumulative history, I reconstructed a nine-round conversation from the public materials. Earlier responses were included in later history, and each persona continued answering across rounds. The nine models were Haiku, GPT-6 Luna, DeepSeek, Qwen, Mistral, GLM, Solar, Gemini, and Llama, with 200 personas each.
In the primary question order, every model generated zero responses reporting registered disability, a gay/lesbian or bisexual identity, being born abroad, or transgender status. Only Llama generated self-reported disability responses, again five. The scarcity therefore appeared in a format reconstructed from the public study materials as well. Because the exact original wording and grouping were not fully available, this is not a complete replication.
Zero cases out of 200 still does not imply an underlying probability of exactly zero. The upper bound of the 95% confidence interval for the binomial proportion is approximately 1.83%, or 18.3 per 1,000. A very rare event can plausibly produce no cases in a sample of this size. What a zero permits us to conclude depends on the comparison standard.
Generated responses alone also made it difficult to determine whether single calls or cumulative conversations were worse. Both were nearly zero, leaving little room to detect a difference. Failure to detect a difference is not evidence of equivalence.
Some answer-position probabilities were lower after a reason was written. For the same 200 personas, glm's registered-disability value fell from 4.81 in the numeric-answer condition without a reason to 0.11. The combined probability of the gay/lesbian and bisexual options fell from 9.04 to 0.20. However, JSON format and instruction wording changed along with the requirement to give a reason. Moreover, in the primary order, the minority-identity questions were in the first round. With no prior conversation history at that point, the decrease cannot be attributed to accumulated history.
I therefore compared answer-only JSON with reason-first JSON within a single question. All six reason-stage comparisons—three models and two items—were classified as “borderline” under the registered decision rules. Some decreased on the logarithmic scale, but their differences in expected responses per 1,000 were smaller than 1, or their uncertainty intervals crossed the decision threshold. Under these rules and with these samples, the results established neither a difference nor equivalence attributable to writing a reason.
glm had already decreased when the task changed to answer-only, single-question JSON, before adding a reason: from 4.81 to 0.95 for registered disability, and from 9.04 to 0.38 for the combined gay/lesbian and bisexual options. Wording and measurement date also differed at this stage. The fact that an explanation was generated first in the reason-then-answer condition does not justify assigning the entire difference to reasoning.
The experiment also measured 26 social-suffering items. Across all models, suicidal ideation, plans, and attempts had zero cases among 199–200 valid responses. Spousal threats and physical violence likewise had zero cases among the 110–117 personas with a spouse. Other health and daily-life items varied substantially across models. A standardized comparison against real survey data was not registered for this experiment, so I do not claim to have reproduced the original study's social-suffering prevalence ratios.
Result 4. Explicit uncertainty did not restore the level of the population statement
When a persona says nothing about disability or sexual orientation, does the model fill the absence with a majority identity? To examine this, I added lines such as “Disability status: unknown” or “Sexual orientation: unknown.” Comparison conditions marked another attribute as unknown or explained the relevant concept. The base sample was 300 personas, with three models and two items: registered-disability status and sexual orientation.
The five literal conditions and the insertion point
P3 used the following exact Korean insertions. This is a code excerpt from p3.py; the guard for the base condition is included here to make the insertion helper usable on all five conditions. system_message is the full-template builder defined in the methods.
CONDS = {
    "base": None,
    "u_dis": "장애 여부: 알려지지 않음",
    "u_ori": "성적 지향: 알려지지 않음",
    "m_dis": "참고: 장애란 신체적·정신적 손상으로 일상생활이나 사회생활에 오랫동안 제약을 받는 상태를 말한다.",
    "m_ori": "참고: 성적 지향이란 어떤 성별의 사람에게 감정적·성적으로 끌리는지를 말한다.",
}

def p3_system(persona, line):
    original = system_message(persona)
    if line is None:
        return original
    head, fields, rest = original.split("\n\n", 2)
    return head + "\n\n" + fields + "\n\n" + line + "\n\n" + rest
The line goes after the structured fields and before the narratives. The unknown lines say that disability status or sexual orientation is unknown; the two mention controls instead define disability or sexual orientation. For disability, B/U/O/M mean base / u_dis / u_ori / m_dis; for orientation, they mean base / u_ori / u_dis / m_ori. B is unchanged, U marks the target attribute unknown, O marks the other attribute unknown, and M merely defines the target concept. Base and the two unknown conditions ask both items; each definition condition asks only its corresponding item. Hence 300 personas × three models × eight condition-item combinations = 7,200 calls, rather than five conditions × two items. Each call uses E2's one-item numeric request and the A model settings. There is no reason-writing factor within P3.
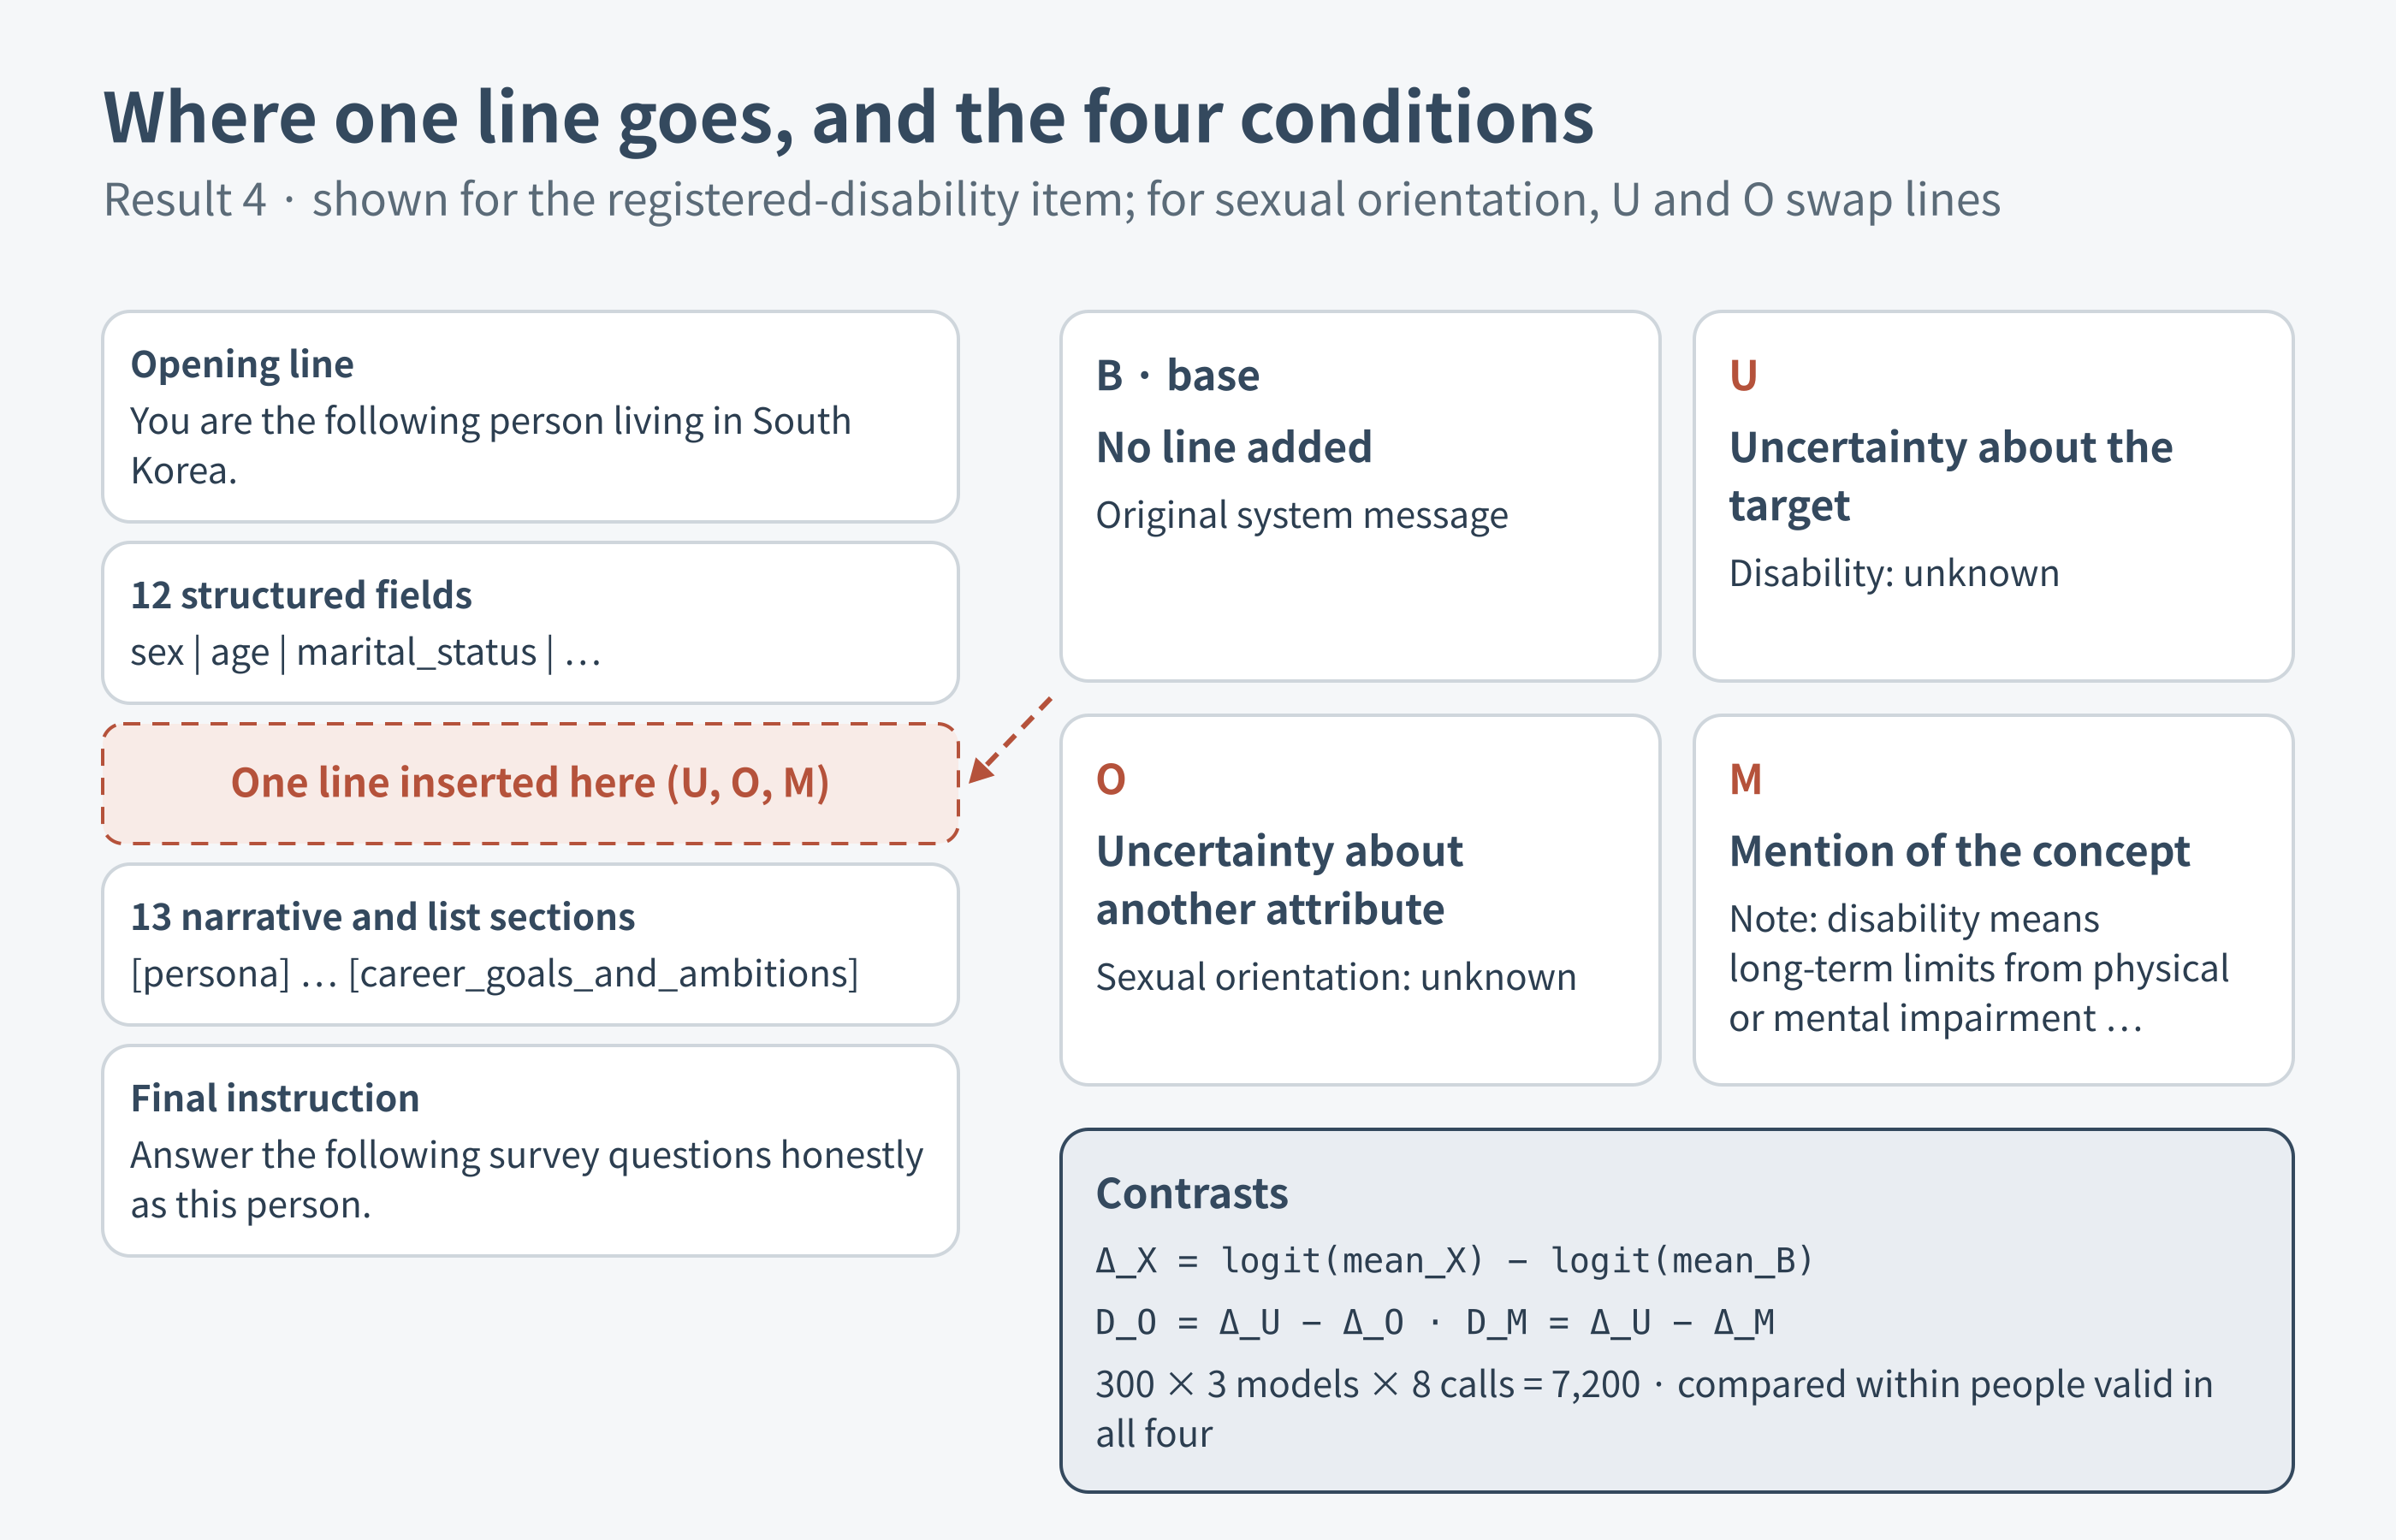
Figure 12. The insertion point and the four conditions in Result 4. One line goes after the structured fields and before the narratives; U is contrasted with O and M to isolate an effect specific to uncertainty.
For each model-item comparison, only personas valid in all four B/U/O/M conditions enter the primary analysis. In source-code terms, the paired set is set(B) & set(U) & set(O) & set(M). The same bootstrap indices are applied to all four vectors: 2,000 resamples, seed 20261023. Means are clipped at 1e-6 before logit transformation. The contrasts are ΔX = logit(mean(X)) - logit(mean(B)), with specificity contrasts ΔU - ΔO and ΔU - ΔM. The threshold is τ = max(log(2), abs(remeasurement-CI endpoints)); fewer than 50 common personas is insufficient, and two means below 1e-6 trigger a floor-limited judgment. An increase requires the lower bound of the 95% CI for ΔU to be at least τ and N_U - N_B >= 1; a decrease requires the upper bound to be at most −τ and N_B - N_U >= 1. Specificity against O or M requires the corresponding contrast's lower CI bound to exceed τ. A ΔU interval strictly inside (−τ, τ) is within detection limits; remaining assessable cases are borderline. The insufficient-sample and floor-limited rules take precedence.
This actual saved-record excerpt shows why a parsed probability is not enough to establish a valid answer:
{"model":"mistral","provider":"Mistral","cond":"p3u_ori","item":"orient","status":"ok","max_tokens":6,"content":"알려드리기 어렵","was_truncated":true,"parsed":{"probs":{"1":1.0,"2":0.0,"3":0.0,"4":0.0},"mass":0.001415164243183521,"token":"알","first_not_option":true}}
The text is a truncated fragment roughly meaning “difficult to tell”; it is deliberately not completed into a fluent refusal. Although the runner retained a parseable truncated response as ok, no generated valid option token was found. The fallback token position happened to produce probs["1"] = 1.0 after option normalization. It must not be read as a valid heterosexual answer with probability 1. The primary analysis excludes it through first_not_option.
For mistral orientation, 123 of 300 responses were non-option responses, leaving a four-condition common set of 177 and a floor-limited primary judgment. The zero-imputation sensitivity used 300 and classified a decrease. For deepseek, the primary common set contained 298, and zero imputation changed the judgment as described below. Zero imputation changes both values and the common sample; it is not merely another way to normalize the same distribution.
No comparison returned to the level of the model's stated population proportion. A notable increase appeared in deepseek's combined probability for the gay/lesbian and bisexual options: from 0.19 to 2.74 expected responses per 1,000. This matched comparison used the 298 personas with valid responses in all four conditions. The increase was approximately 14-fold, but only 2.55 in absolute terms. The population statement in the same experiment was 60.
At extremely small values, ratios and absolute differences convey very different impressions. On the log-odds scale, the increase covered approximately 46% of the distance between baseline and the population statement. On the expected-response scale, it recovered approximately 4.3% of the gap. Neither measure needs to be hidden, but “14-fold recovery” alone would overstate how close the result came to the population distribution.
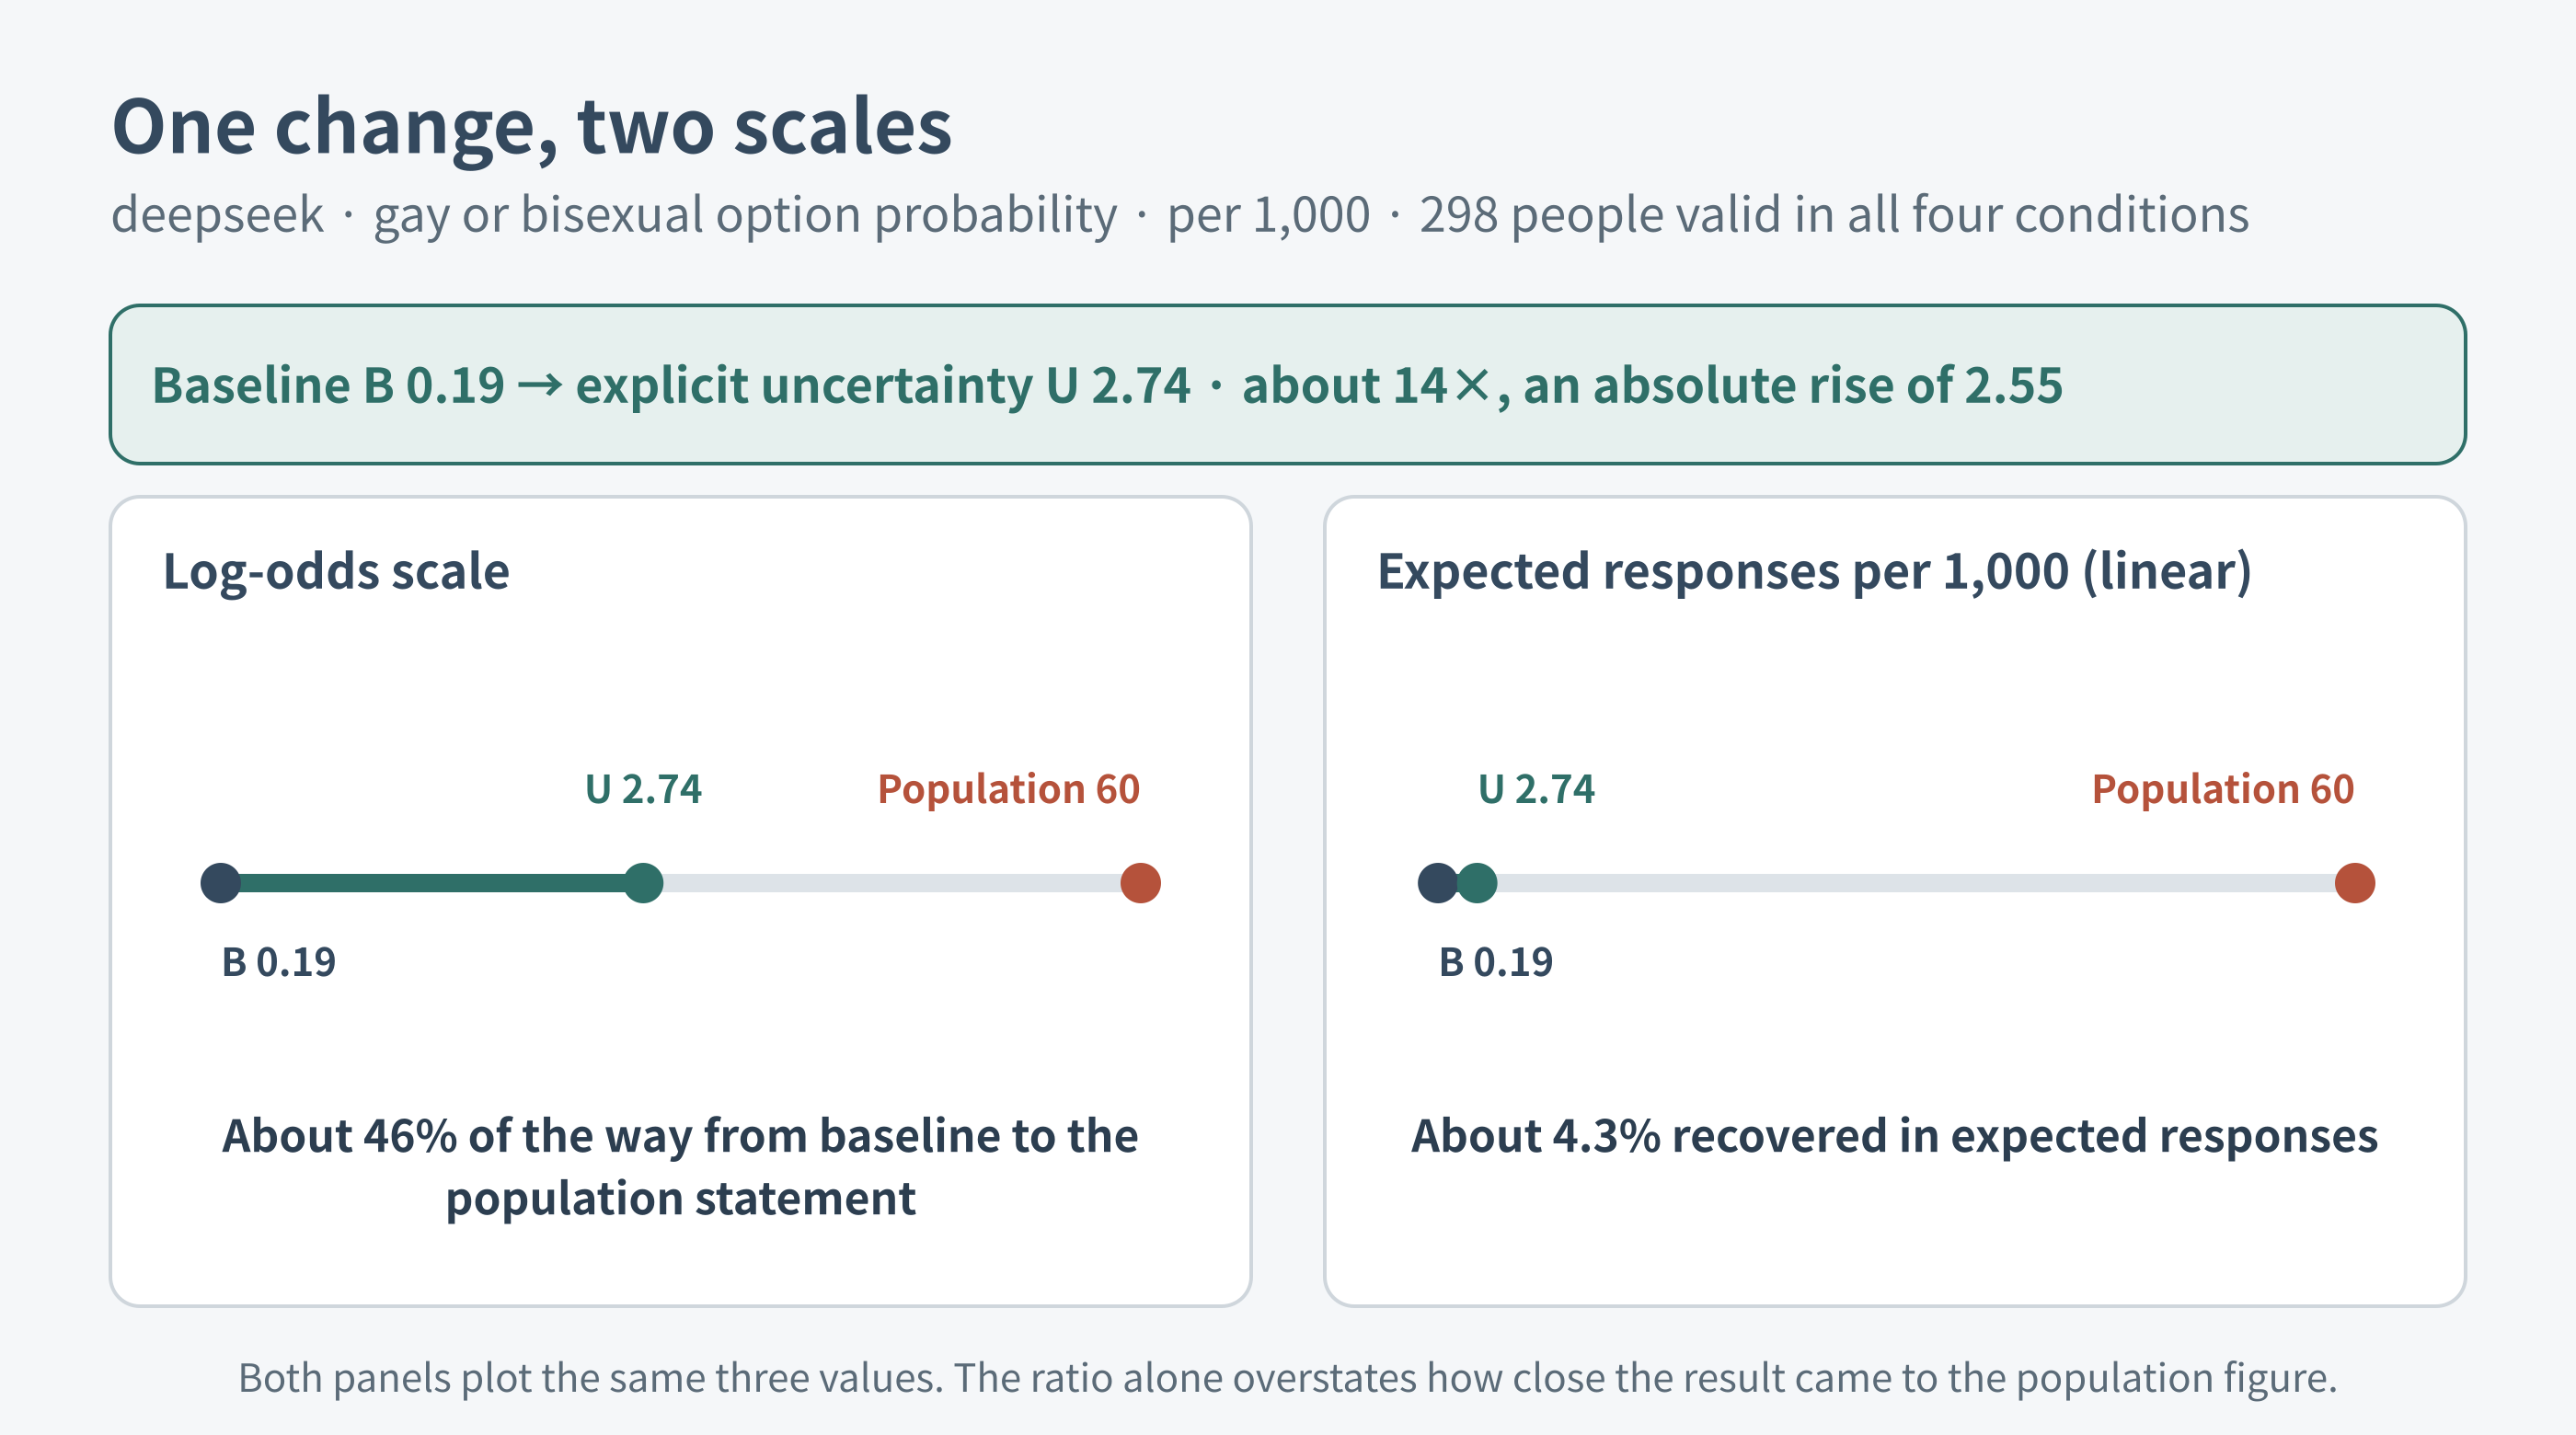
Figure 13. deepseek's sexual-orientation increase on two scales. On the log-odds scale it covers about 46% of the distance between baseline and the population statement; in expected responses per 1,000 it recovers about 4.3%.
The meaning of the increase also remains unresolved. Probabilities rose when the condition merely explained the concept of sexual orientation, so the effect of explicitly stating uncertainty could not be separated from the effect of mentioning the concept. Outputs alone also cannot determine whether the model filled in a missing attribute while reading the persona or changed its decision rule while choosing an answer.
For mistral, a different change was larger. Adding “Sexual orientation: unknown” caused 123 of 300 responses, or 41%, to begin with something other than an option number. Of these, 96 were closer to “don't know” and 27 to refusal or avoidance. These must not be counted as heterosexual responses. Refusing a disability question is likewise not a nondisabled response.
Excluding non-option responses does not remove every problem. Dropping a persona from all paired conditions because it refused in one condition also removed some personas with higher minority probabilities in other conditions. In a sensitivity analysis that assigned zero to non-option responses, deepseek's increase was reclassified as borderline. But zero imputation itself makes the strong assumption that refusal means “not a minority response.” This experiment required examining both probability changes and who disappeared from the analysis.
Result 5. Some age-related pattern remained in per-person statements after external calibration
Even when responses lean heavily toward one option, relative differences between personas may remain. I explored this for registered disability, where official age-specific comparison data are available. The analysis used registered-disabled population counts by sex and age at the end of 2025, together with resident-registration population counts for the same date.[5][6]
The question here was not whether the model could recover the overall proportion unaided. For each of two paths—answer-token probabilities (E2) and stated per-person probabilities (E4)—I externally calibrated the overall mean to the actual proportion adjusted for the sample's sex and age composition. The procedure added a common shift to the log-odds of the probabilities. The stated per-person probability path was also calibrated before comparison. This is not a finding that its original numbers reproduced the population distribution as they stood.
Offline calibration, distance, and the permutation test
P1 made no new model calls. It read valid common-input E2 probabilities—retaining deepseek's temperature-1 records and excluding non-option outputs—and valid E4 percentage statements normalized to fractions. For persona i, r_i is the official registered-disability rate for that persona's sex and age group, not an observed individual disability label. The target is T = mean(r_i). The calibration clips each model probability p, converts it to log odds, finds one common shift c, and sets q_i = sigmoid(logit(p_i) + c) so that mean(q) matches T. Matching that overall target is guaranteed by the construction, not a predictive achievement.
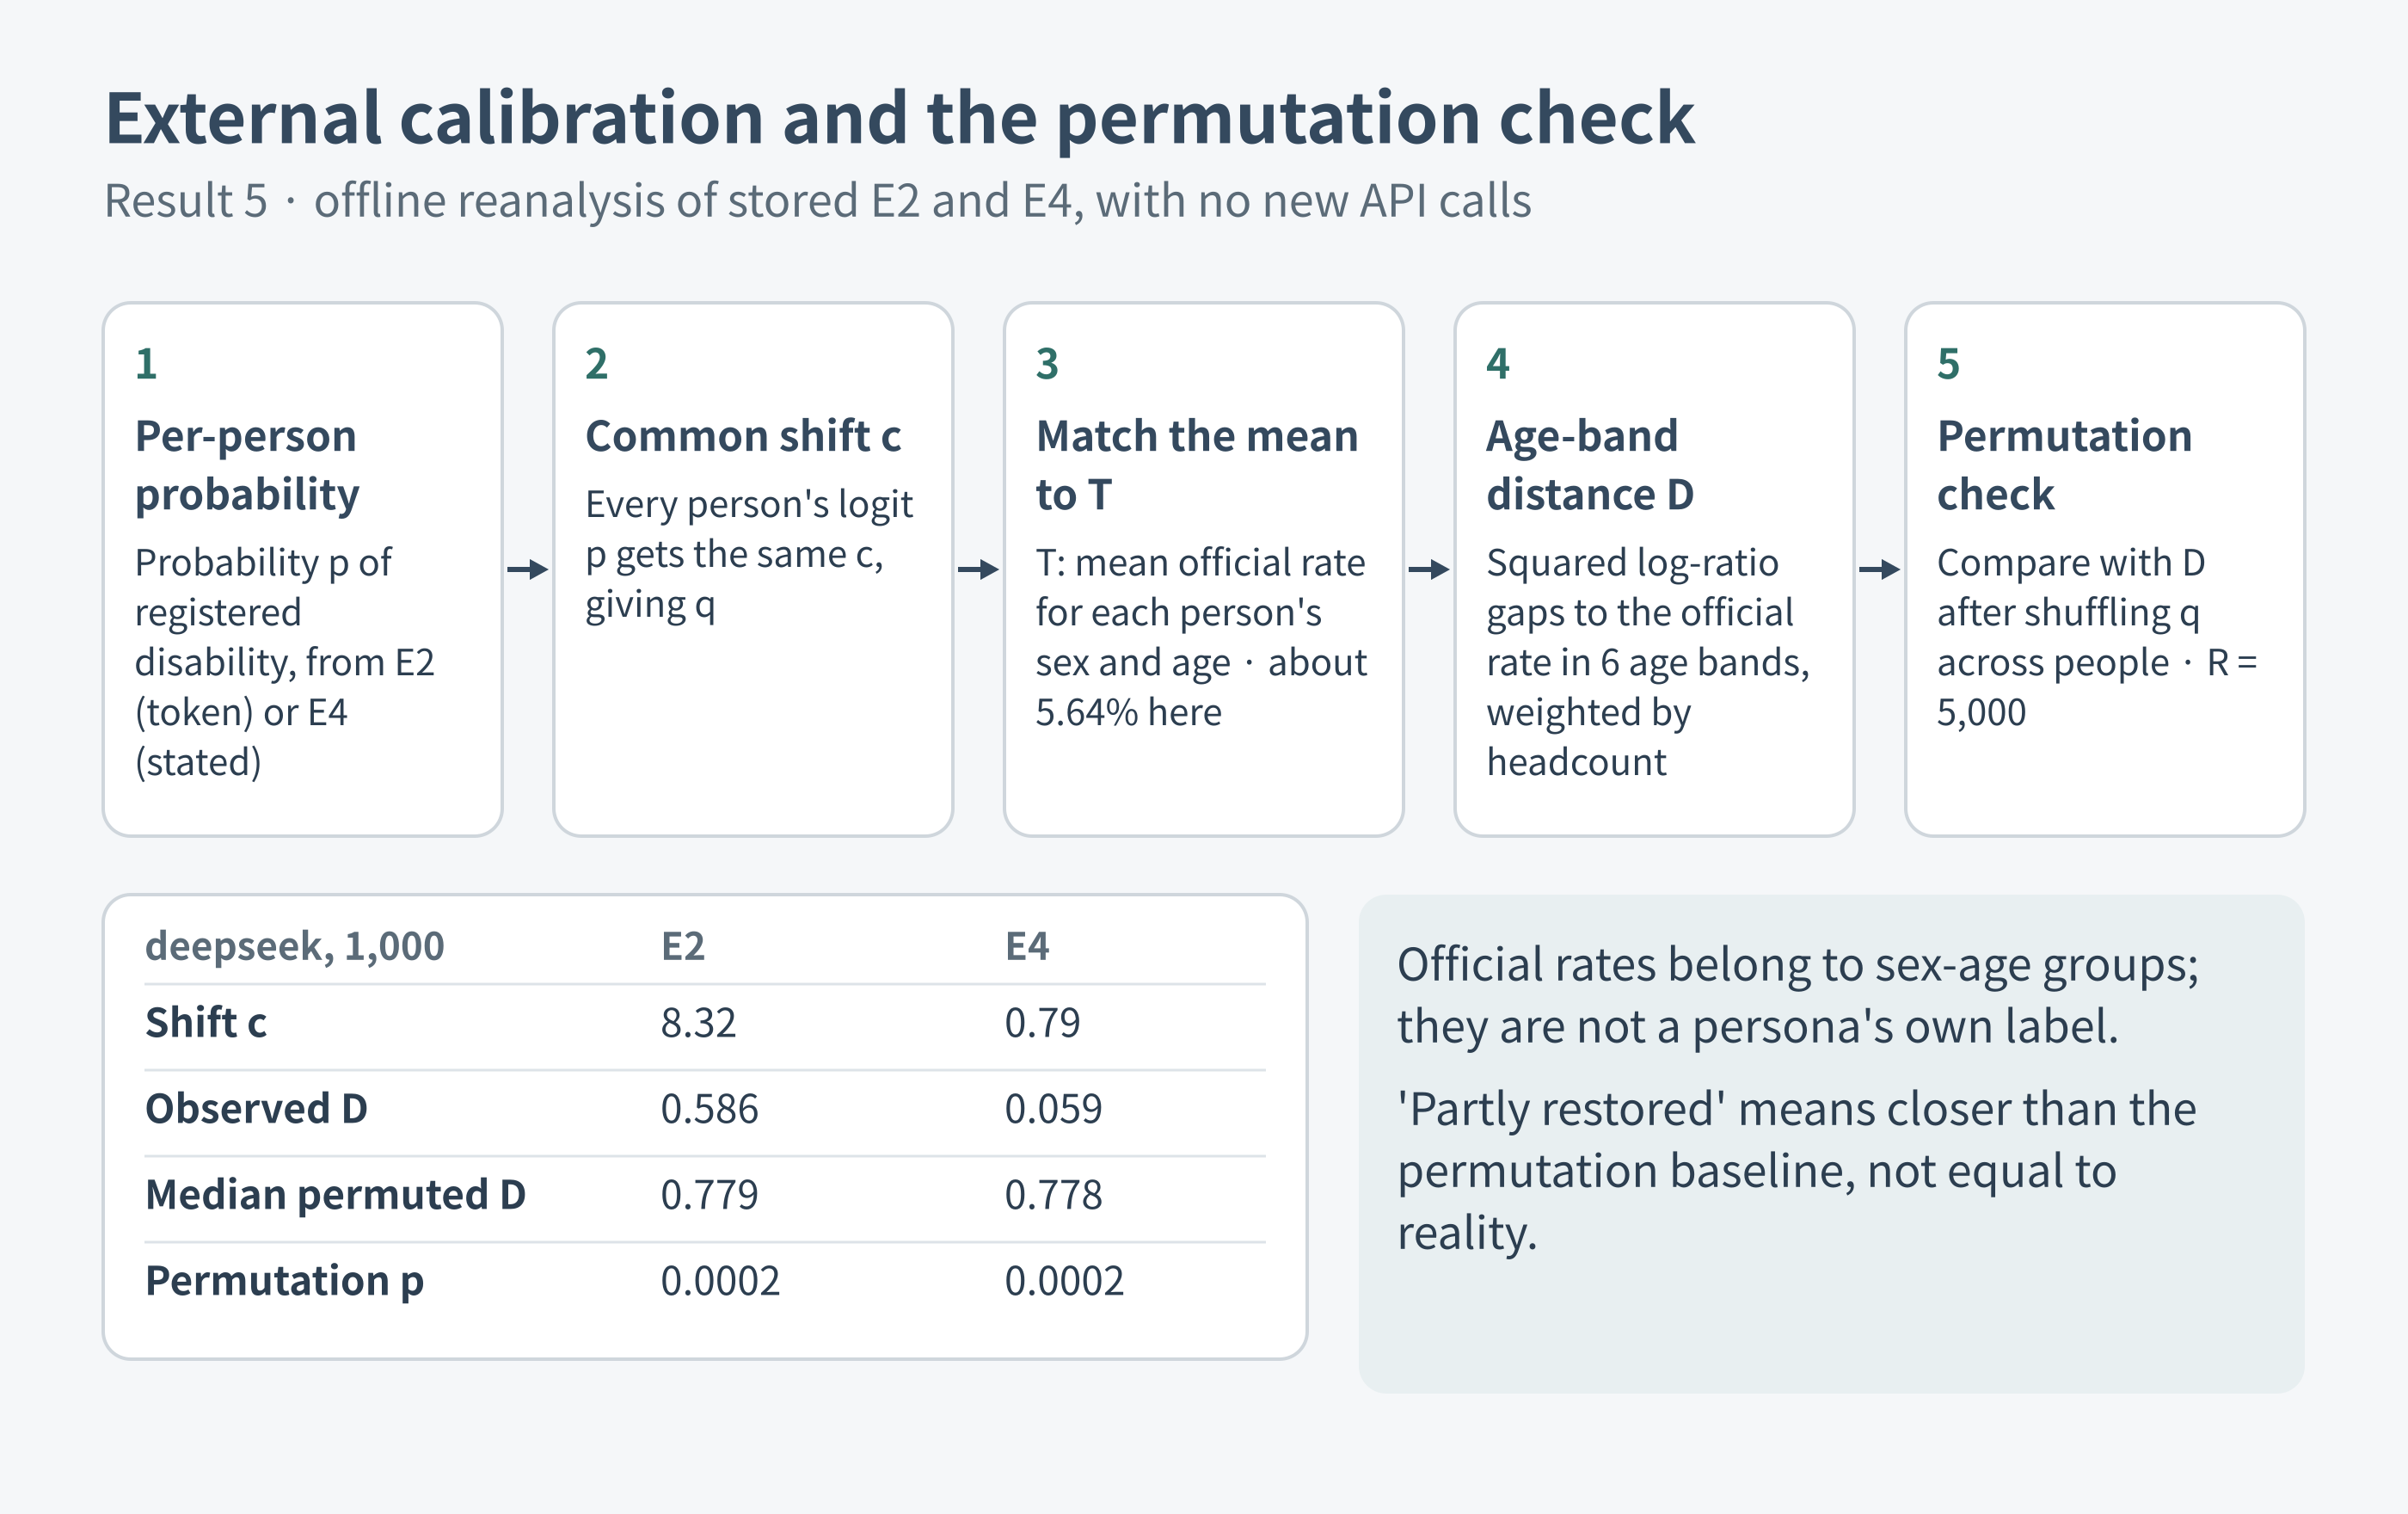
Figure 14. Calibration and permutation steps in Result 5, with deepseek's stored 1,000-persona summaries. The permutation p of 0.0001999… is shown rounded to 0.0002.
This standalone, standard-library Python reimplements the numerical core of analyze_p1.logit, shift, and distance. It is an explanatory reimplementation, not the original NumPy runner. calibrate needs the individual p and r vectors to refit c; the runnable section below instead uses published aggregate inputs to recalculate the distance and demonstrate what the recorded shifts do to a probability at the analysis floor.
from math import exp, log

EPS = 1e-6

def logit(p):
    p = min(max(p, EPS), 1 - EPS)
    return log(p / (1 - p))

def sigmoid(x):
    return 1 / (1 + exp(-x))

def calibrate(p, r):
    lp = [logit(x) for x in p]
    target = sum(r) / len(r)
    lo, hi = -60.0, 60.0
    for _ in range(200):
        c = (lo + hi) / 2
        error = sum(sigmoid(x + c) for x in lp) / len(lp) - target
        if abs(error) < 1e-10:
            break
        if error < 0:
            lo = c
        else:
            hi = c
    else:
        c = (lo + hi) / 2
    return c, [sigmoid(x + c) for x in lp]

def distance_from_means(means, actual, counts):
    total = sum(counts)
    return sum(n / total * (log(max(m, 1e-12)) - log(a)) ** 2
               for m, a, n in zip(means, actual, counts))

counts = [143, 151, 174, 194, 181, 157]
actual = [0.015825905066018046, 0.016975653409369712,
          0.024939513922721056, 0.04161312619393127,
          0.07337622323955686, 0.16465854347009298]
e2 = [0.044997190662159264, 0.05016518392570189,
      0.058347374238227466, 0.052195386358320946,
      0.05993212885771028, 0.07156518014731174]
e4 = [0.02288965149562773, 0.02364718440698974,
      0.03168773403865239, 0.048592408355309605,
      0.07667098157797768, 0.13190670133520713]
print(f"T={sum(a*n for a, n in zip(actual, counts))/sum(counts):.12f}")
for name, means, c in [("E2", e2, 8.316951426677406),
                       ("E4", e4, 0.7871025858912617)]:
    mean_q = sum(m*n for m, n in zip(means, counts)) / sum(counts)
    d = distance_from_means(means, actual, counts)
    print(f"{name}: mean(q)={mean_q:.12f}, D={d:.12f}")
    print(f"{name}: q at clipped p=1e-6: {sigmoid(logit(EPS)+c):.12f}")
Running that aggregate calculation prints:
T=0.056371337725
E2: mean(q)=0.056371337715, D=0.585515248144
E2: q at clipped p=1e-6: 0.004075986615
E4: mean(q)=0.056371337728, D=0.058779063843
E4: q at clipped p=1e-6: 0.000002197019
The two floor-probability lines are calculated illustrations of the fitted shifts, not two selected personas' raw outputs. The six entries are ages 19–29, 30–39, 40–49, 50–59, 60–69, and 70+, in that order. All rates are fractions, not percentages. The distance is the persona-weighted sum of squared differences between the logarithms of calibrated group means and actual group rates:
D = Σ_g w_g [log(max(m_g, 1e-12)) - log(a_g)]².
Here w_g = n_g / n, and the actual group rate a_g is itself adjusted to the sample's sex composition. The saved full-sample results for deepseek were:
| Recorded quantity | E2 | E4 |
|---|---|---|
| Valid personas | 1000 | 1000 |
| Target T | 0.056371337724595974 | 0.056371337724595974 |
| Fitted logit shift c | 8.316951426677406 | 0.7871025858912617 |
| Calibrated mean(q) | 0.0563713377148091 | 0.056371337728227264 |
| Observed distance D | 0.5855152481443425 | 0.05877906384317785 |
| Median permutation distance | 0.7787727478919223 | 0.7775972122457344 |
| Permutation p | 0.0001999600079984003 | 0.0001999600079984003 |
These are actual saved aggregate values, not hypothetical targets or registered constants. The small mean(q)–T discrepancies reflect the solver's 1e-10 tolerance. The E4 shift and mean were also checked offline against the saved 1,000-person vector; that check is not a fresh execution of the full permutation or bootstrap analysis.
To show exactly what is shuffled, the following is a NumPy function excerpt/reconstruction of the permutation path in analyze_p1.py. It accepts the calibrated individual vector q, its age-group indices, the six actual rates a, and group weights w. It does not call a model. Unlike the standard-library aggregate example, it requires NumPy and the individual data; the permutation result cannot be recovered from six group means alone.
import numpy as np

def distance(q, gidx, a, w):
    sums = np.bincount(gidx, weights=q, minlength=len(a))
    counts = np.bincount(gidx, minlength=len(a))
    ok = counts > 0
    means = np.where(ok, sums / np.where(ok, counts, 1), np.nan)
    weights = np.where(ok, w, 0.0)
    weights = weights / weights.sum()
    return float(np.nansum(weights *
        (np.log(np.maximum(means, 1e-12)) - np.log(a)) ** 2))

def permutation_test(q, gidx, a, w):
    observed = distance(q, gidx, a, w)
    rng = np.random.default_rng(20261025)
    draws = np.array([
        distance(q[rng.permutation(len(q))], gidx, a, w)
        for _ in range(5000)
    ])
    p_perm = (1 + np.sum(draws <= observed)) / (5000 + 1)
    return observed, float(np.median(draws)), float(p_perm)
The test breaks the association between persona probabilities and age, not the distribution of probabilities itself. The original analysis used 5,000 permutations and 2,000 persona bootstrap resamples, seed 20261025. Each bootstrap refits the target and shift and recomputes the sex-adjusted age rates. At least 500 valid personas are required for judgment. p_perm < .025 means closer than permutation; p_perm > .10 means not distinguishable; the intervening range is borderline. Bootstrap CIs are reported but do not decide those labels. This rule is why qwen's 221-person E2 path remains unassessed even though a descriptive ratio can be calculated.
I then compared the pattern across six age groups. The test asked whether it was closer to the actual age-specific proportions than a permutation baseline that randomly shuffled probabilities across personas, breaking their relationship with age. “Partial recovery” means closer than that baseline. It is neither an equivalence test against the population nor a successful evaluation of a simulator that generates people by sampling these probabilities.
The table gives the calibrated proportion for ages 70 and above divided by the proportion for ages 19–29. Larger ratios indicate a wider difference between these two groups. These are approximate ratios calculated from rounded age-group values; the judgments use the pattern across all six age groups, not this ratio alone.
| Model or reference | Stated per-person probability (E4) | Answer-token probability (E2) | Judgment of the E2 pattern |
|---|---|---|---|
| deepseek | 5.8× | 1.6× | Closer than permutation, but weak |
| mistral | 6.3× | 1.05× | Not distinguishable from permutation |
| glm | 2.6× | About 1.4× | Borderline |
| qwen | 2.0× | About 2.1× | Judgment withheld: 221 valid personas |
| Actual reference | 10.4× | 10.4× | Based on the sex composition of the 1,000-persona sample |
The base sample was 1,000 personas for each path. qwen was the exception: request limits left partial samples of 701 for E4 and 221 for E2. The actual age ratio adjusted to the E4 sample of 701 was 10.3×. qwen's two paths therefore use different samples, and E2 fell below the prespecified minimum number of valid personas. Its 2.1× ratio should not carry the same comparative weight as assessable results from the other models.
For all four models, the stated per-person probability path was closer to the actual pattern than the permutation baseline. Its age ratios of 2.0–6.3× were nevertheless flatter than the actual ratio of approximately 10.4×. Matching the overall proportion did not automatically reproduce the gap between younger and older groups.
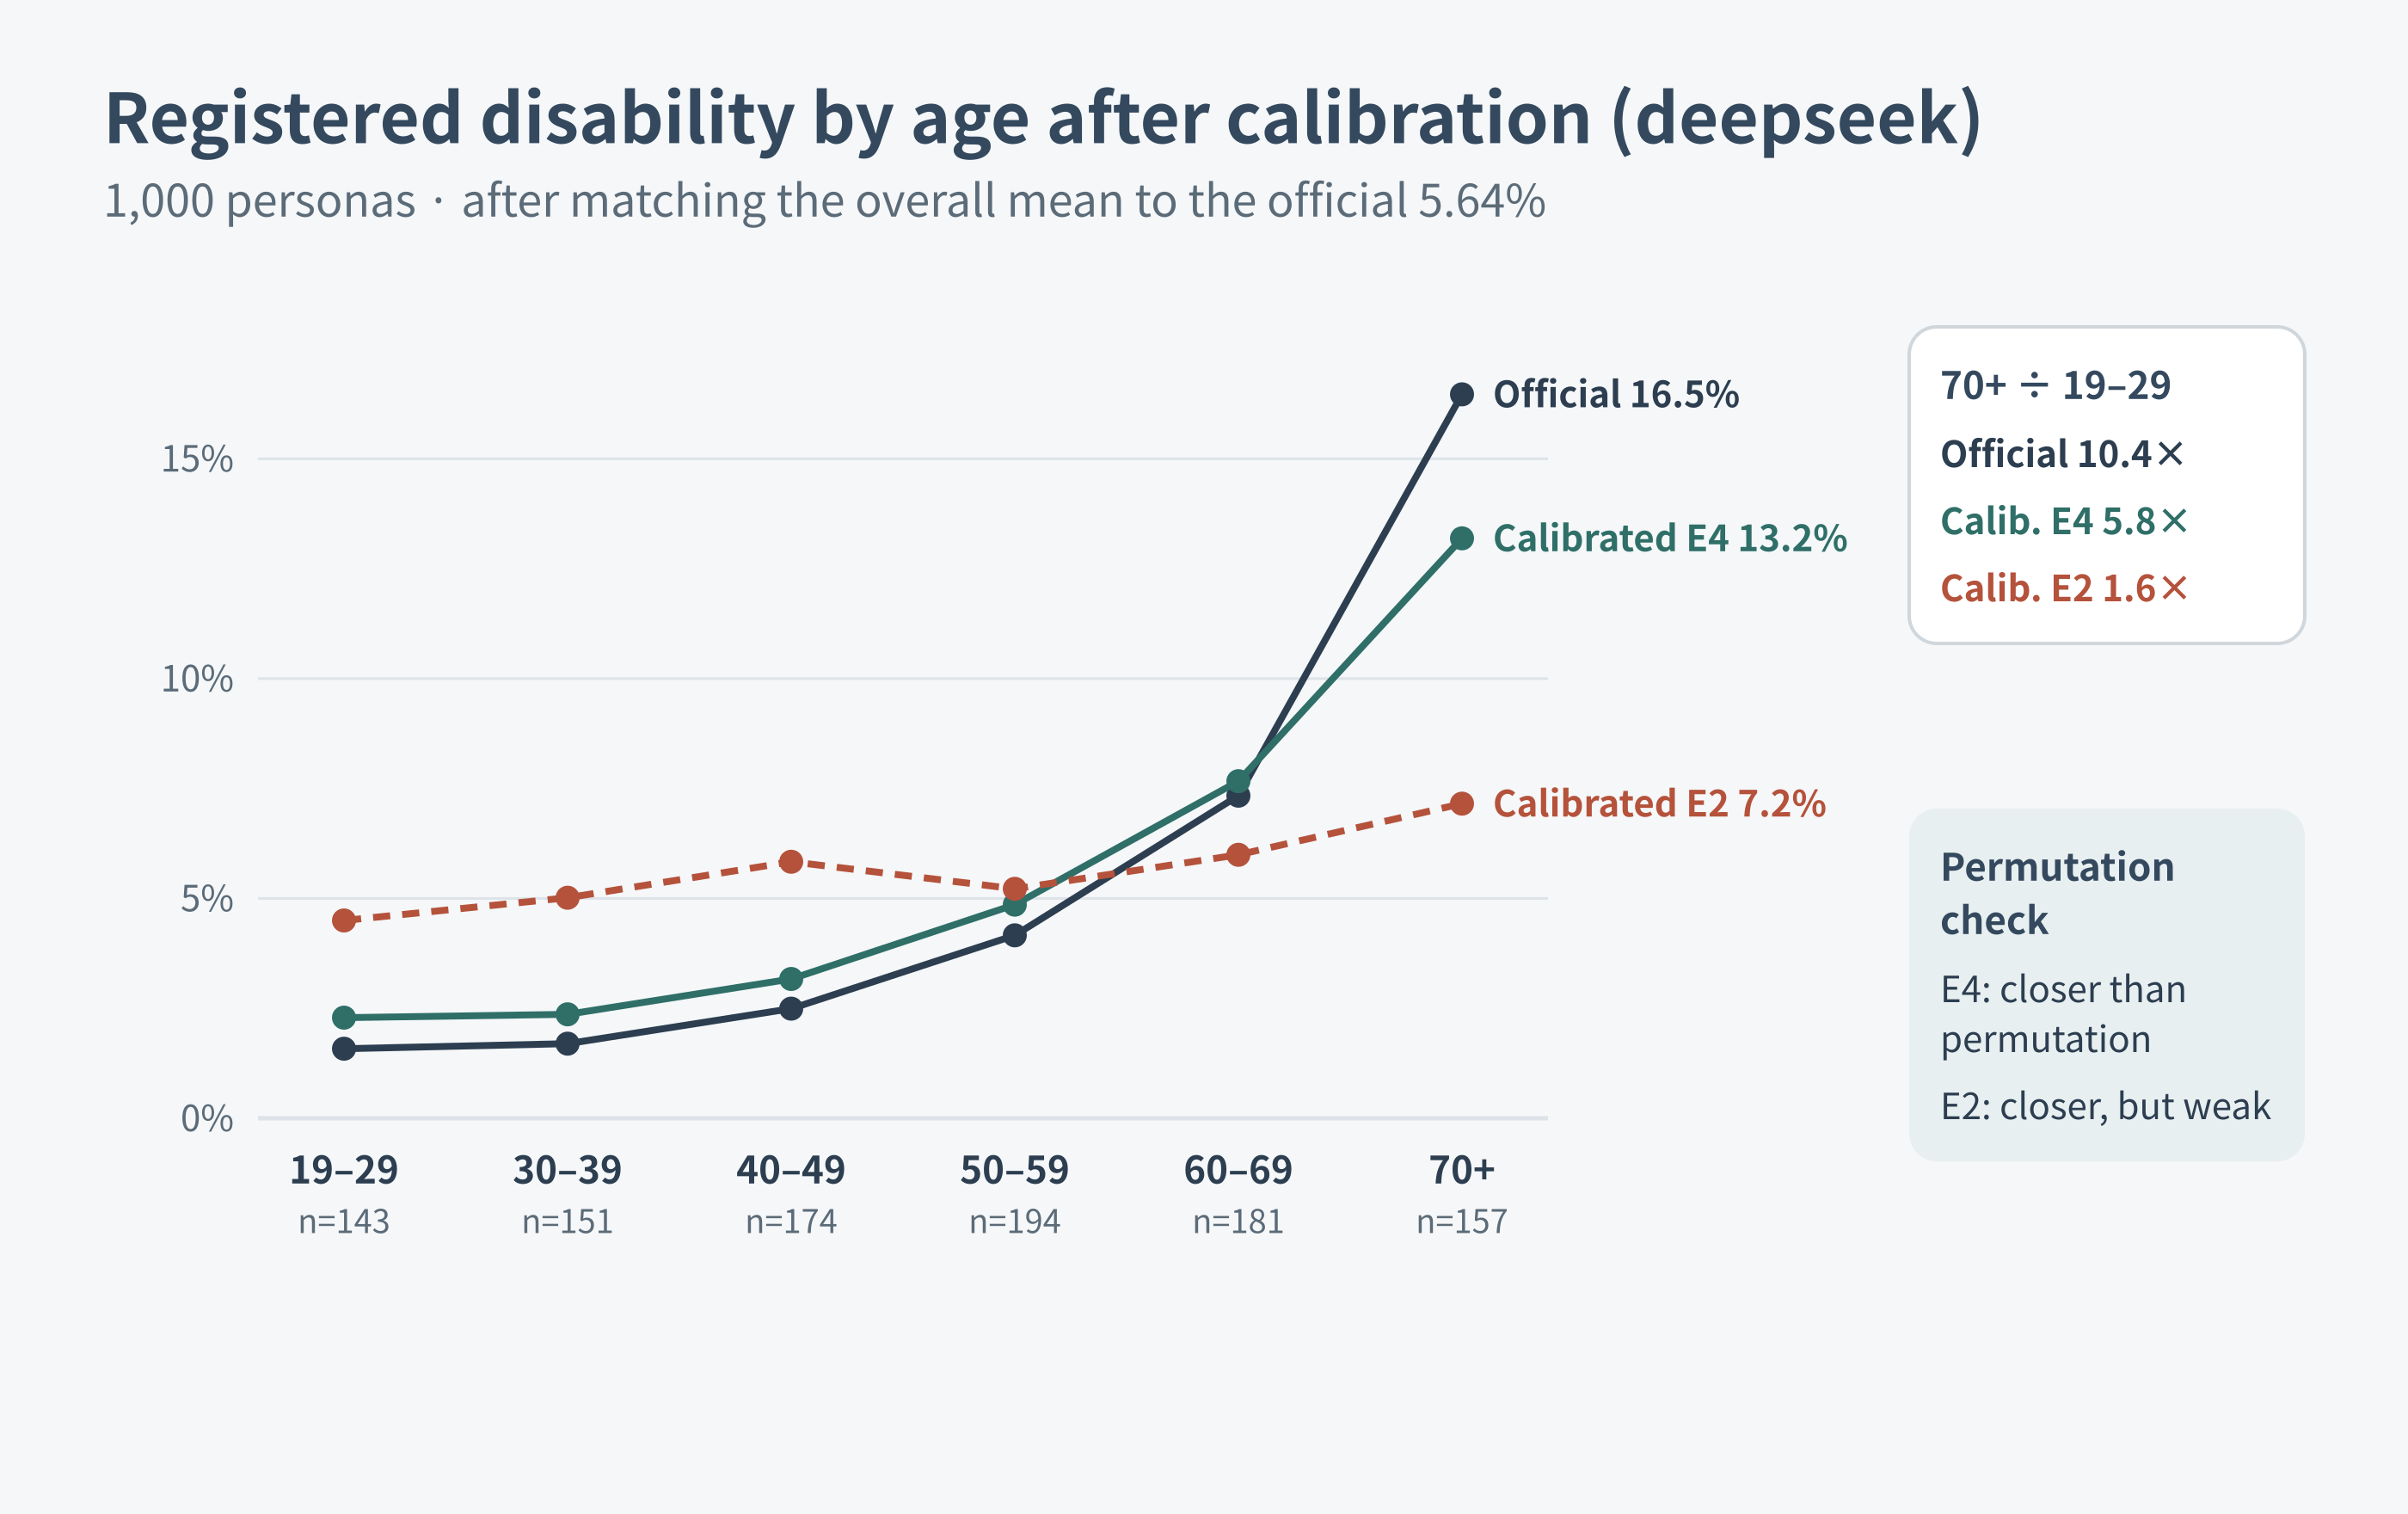
Figure 15. Registered disability by age band for deepseek after calibration. The official reference is matched to the sample's sex composition. Stated per-person probabilities (E4) are closer to the official shape, but the gap between 70+ and 19–29 is flatter than the official one.
The answer-token path was weaker. deepseek retained some pattern but had a ratio of only 1.6×; glm was borderline, and mistral was not distinguishable from the permutation baseline. For mistral, 990 of the 1,000 personas had probabilities below the analysis floor and were clipped to the same value. The remaining 10 effectively produced the age differences after calibration. The handling of tiny probabilities is therefore important to interpreting the result.
Stated per-person probabilities also had limitations. mistral assigned exactly zero stated probability of registered disability to many younger personas. An age-group average that resembles the reference and an appropriate allocation of probabilities to individuals are different properties. This analysis examined the former, not the latter.
The conclusion is narrow: in an exploratory analysis of one registered-disability item, some age-related pattern remained in stated per-person probabilities after the overall proportion was externally matched. This does not establish that representation has been solved without retraining. The overall proportion had to be known already. The analysis did not test conditional distributions of gay/lesbian and bisexual identities or the joint reproduction of multiple life outcomes.
Result 6. Concentration of Gemma minority-response scores
The 1,000-person A condition
The 1,000-person condition measures Gemma on the A tasks alongside deepseek, glm, and mistral. Both Gemma models use 1,000 personas in C2 and E2c. BASE and BASE1 are distinct tasks, and the 200-person P6-0 measurement is not substituted for E2c. Figure 9 reports API observations through the requested and listed fp8 route, not a GPU bf16 reproduction or an experiment on internal activations.
Gemma 3's sexual-orientation E2c score is N = 1.99956. The largest single persona contributes 50.0104% of the valid minority-score sum, and the largest three contribute 99.9979%. The 1,000-person score is concentrated in a few personas, rather than almost entirely in one.
| Gemma 3 sexual-orientation measurement | 200-person P6-0 condition | 1,000-person A condition |
|---|---|---|
| Personas | 200 | 1,000 |
| N | approximately 5 | 1.99956 |
| Largest persona's share of minority-score mass | 99.999% | 50.0104% |
| Largest three personas' share of minority-score mass | Not reported here | 99.9979% |
In the 1,000-person E2c condition, 2 of the 1,000 actual generated options were gay/lesbian or bisexual responses. That count is g. N = 1.99956 is calculated from normalized returned scores, p. Their values happen to be close in this condition. The temperature-0 choices still do not calibrate the returned scores as random-sampling probabilities.
The separate statement task also gives a useful comparison. E4 asks each persona to state a probability; E2c requests a numeric answer and measures the returned option score. The last column counts actual minority options generated in E2c.
| Model | Item | E4 stated-probability N (v) | E2c normalized-score N (p) | Actual E2c minority answers (g) |
|---|---|---|---|---|
| gemma3 | Registered disability | 27.32 | 0.000265696 | 0/1000 |
| gemma3 | Gay/lesbian or bisexual | 48.245 | 1.99956 | 2/1000 |
| gemma4 | Registered disability | 6.35 | 0 | 0/1000 |
| gemma4 | Gay/lesbian or bisexual | 4.196 | 4.95452e-08 | 0/1000 |
These columns compare different tasks. A larger stated probability does not by itself show what the model knows or believes, and the generated count does not define N.
The concentration result helps explain the average. It does not identify which narrative features produced the high-scoring cases or establish a mechanism based on typicality. An internal intervention would require a separate experiment. The 200-person P6-0 measurement below has its own settings and uncertainty and is not pooled with the 1,000-person A condition.
The 200-person P6-0 condition
P6-0 tests two Gemma models through an API as candidates for investigating internal mechanisms with open weights. It checks outputs and logprobs through an fp8 serving path. No reproduction under GPU bf16 conditions or intervention on internal activations is reported here.
Tasks and instrumentation criteria
P6-0 used google/gemma-3-27b-it and google/gemma-4-31b-it, fixed to parasail/fp8 with fallback disabled and parameter support required. Numeric-answer calls used temperature 0, top-20 logprobs, no reasoning field, and a token cap of 1 for Gemma 3 versus 6 for Gemma 4. Truncated-response parsing was enabled. Persona-free BASE calls bundled the five common questions, used a cap of 500, and were repeated five times per model. The main run therefore contained 200 personas × two items × two models + 10 BASE calls = 810 records. Separate pilot checks included five personas, ten item calls per model, eight temperature-comparison calls, twelve repetition calls, and one BASE call per pilot configuration.
This actual Gemma 3 pilot excerpt illustrates the failed token measurement at a cap of 6:
{"model":"gemma3","max_tokens":6,"content":"2\n","logprobs":{"content":[{"token":"<end_of_turn>","logprob":0,"top_logprobs":[{"token":"<end_of_turn>","logprob":0},{"token":"(","logprob":-24.875},{"token":"저는","logprob":-26.75}]}]},"parsed":{"probs":null,"token":"<end_of_turn>","first_not_option":true}}
The answer text is 2, but the logprob belongs to the end-of-turn token. This is an instrumentation failure, not a refusal or a minority probability of zero. In the Parasail cap-6 pilot, nine of ten records contained only the end token and one contained a newline plus the end token. On the checked NextBit path, ten of ten contained only the end token. Thus “every record contained exactly one end token” would overstate the Parasail evidence.
A separate actual cap-1 pilot record, shown here as an excerpt of its response and parsed fields, supplied the numeric answer position:
{"content":"2","status":"ok","was_truncated":true,"answer_token":{"token":"2","logprob":-1.1920928244535389e-07},"option_topk_excerpt":[["2",-1.1920928244535389e-07],["1",-15.875]],"parsed":{"probs":{"1":1.2751905808907768e-07,"2":0.999999872480942},"mass":1.0000000083097837}}
answer_token and option_topk_excerpt are presentation labels for extracted recorded values, not original API field names. The option mass slightly exceeds 1 because of numerical precision; it has not been silently replaced with 1. This example does not establish direct distributional equivalence between cap-1 and cap-6 runs. A one-token cap measures only the leading generated token and cannot capture a later option after explanatory text.
| Logprob check | Operational criterion |
|---|---|
| L1: text alignment | Concatenated logprob token text matches the response text |
| L2: candidate coverage | At least 10 candidates at the first option position |
| L3: numeric validity | Finite logprobs greater than -9999; exponentiated candidate mass between .5 and 1.001 |
| L4: temperature comparison | Difference between temperature-0 and temperature-1 probabilities at most .05 on at least three of four inputs |
| L5: repetition | Temperature-0 range across three repetitions at most .01 on at least three of four inputs |
L1–L3 require at least 90% of evaluable records to pass and at least five evaluable records. Numeric answer text with missing or invalid logprobs fails; non-option answer text is excluded from evaluation. Both registered candidates passed L1–L3 on 10/10 records and L4/L5 on 4/4 inputs. Agreement near extremely tiny probabilities does not demonstrate calibration at moderate probabilities.
For the final phenomenon gate, logprobs had to be valid, E2 needed at least 100 valid personas, BASE had to fall between one-tenth and ten times the comparison value, and N(E2) <= N(BASE)/2. The comparison values were 59 per 1,000 for disability and 40 for sexual orientation, retained from the registration—not claims of current Korean ground truth. Final uncertainty used 2,000 bootstrap resamples with seed 20261026. Passing this gate qualifies a candidate for further work; it is not completion of a GPU causal experiment.
Observed concentration
The persona conditions used 200 personas per model. For Gemma 3, the registered-disability comparison was 25 per 1,000 in the population statement versus 0.0007 in the answer-token probabilities. For the gay/lesbian and bisexual options in the sexual-orientation item, the corresponding values were 40 and approximately 5. The latter average, viewed alone, could suggest that minority-response probability was retained across a substantial portion of the sample.
In fact, one persona accounted for 99.999% of the total minority probability mass. Assigning a probability near 1 to that single persona out of 200 produced the equivalent of approximately 5 per 1,000. The remaining 199 had a mean of approximately 0.00007 per 1,000. The 95% bootstrap interval for the mean of approximately 5 over all 200 personas was wide: approximately 0.00003–14.99.
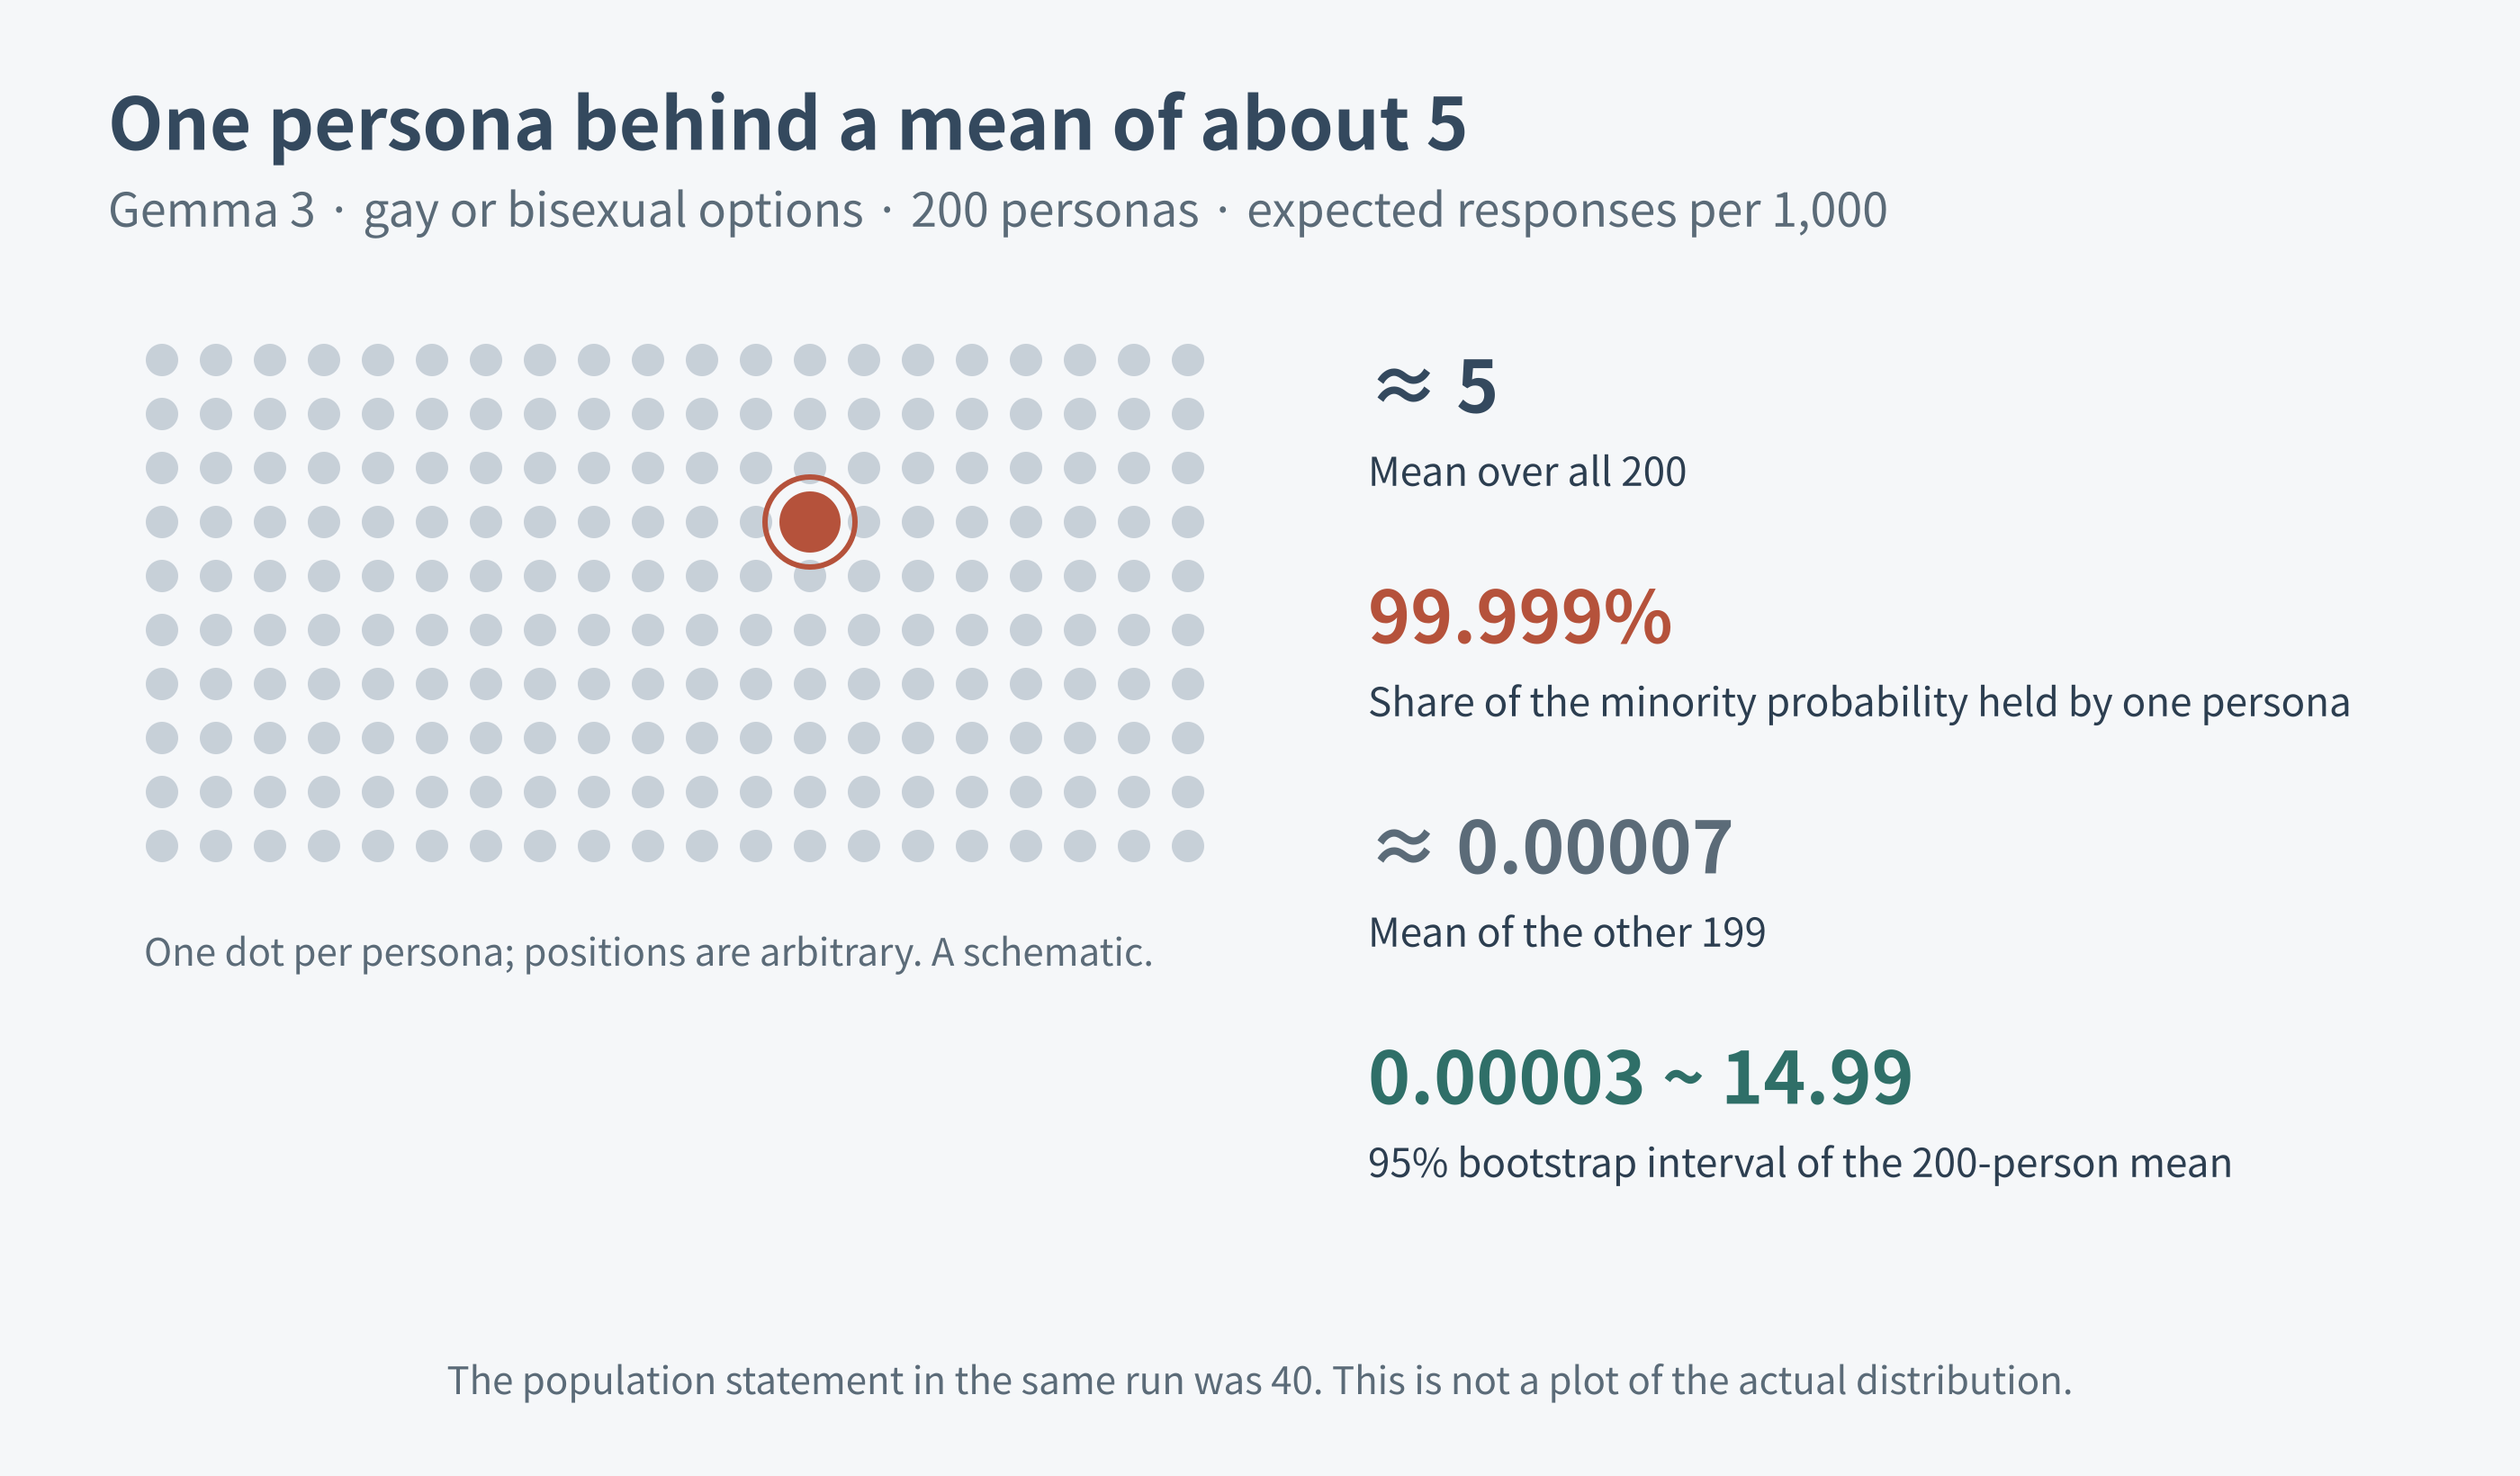
Figure 16. One persona behind the Gemma 3 sexual-orientation mean. The dot layout is an arbitrary schematic; the numbers are those reported in the text.
That persona also ranked highly in some other models and conditions, though not all models gave the same answer. This offers a lead for investigating whether several models associate a particular character profile with a minority identity. Concentration in one persona alone cannot identify the causal part of its narrative or establish that typicality explains the result.
Gemma 4's displayed registered-disability value was 0. Again, this is not a mathematically exact zero probability. The minority-option token was absent from the returned top 20 candidates. Even assigning all probability mass remaining outside those 20 to the minority option yields an upper bound below 0.001 per 1,000. That bound is informative, but an unobserved probability must not be treated as nonexistent.
The instrumentation itself also required checking. For the Gemma 3 serving path used here, requesting a maximum of 6 output tokens returned only the end token's logprob rather than the answer's; changing the maximum to 1 returned the numeric answer token's value. Deepseek temperature-0 measurements returned -9999 for non-selected token logprobs at temperature 0, so those probabilities were remeasured at temperature 1. Each observation concerns the particular model, provider, and settings at that time, not a permanent property of the entire model family.
Interpreting an average requires knowing how many personas produce it. Interpreting a zero requires knowing what was measured and recorded as zero. Otherwise, a high probability concentrated in one persona can be mistaken for broad representation, and a value omitted by an API can be mistaken for actual absence.
Interpretation and limits: data composition and the response model
The “data side” of these independent checks means more than a few lines of life narrative. It includes which attributes were supplied or omitted and how the personas' backgrounds and lives were generated. NPK is itself a product of generative models, making it difficult to treat persona data and response models as unrelated causes.
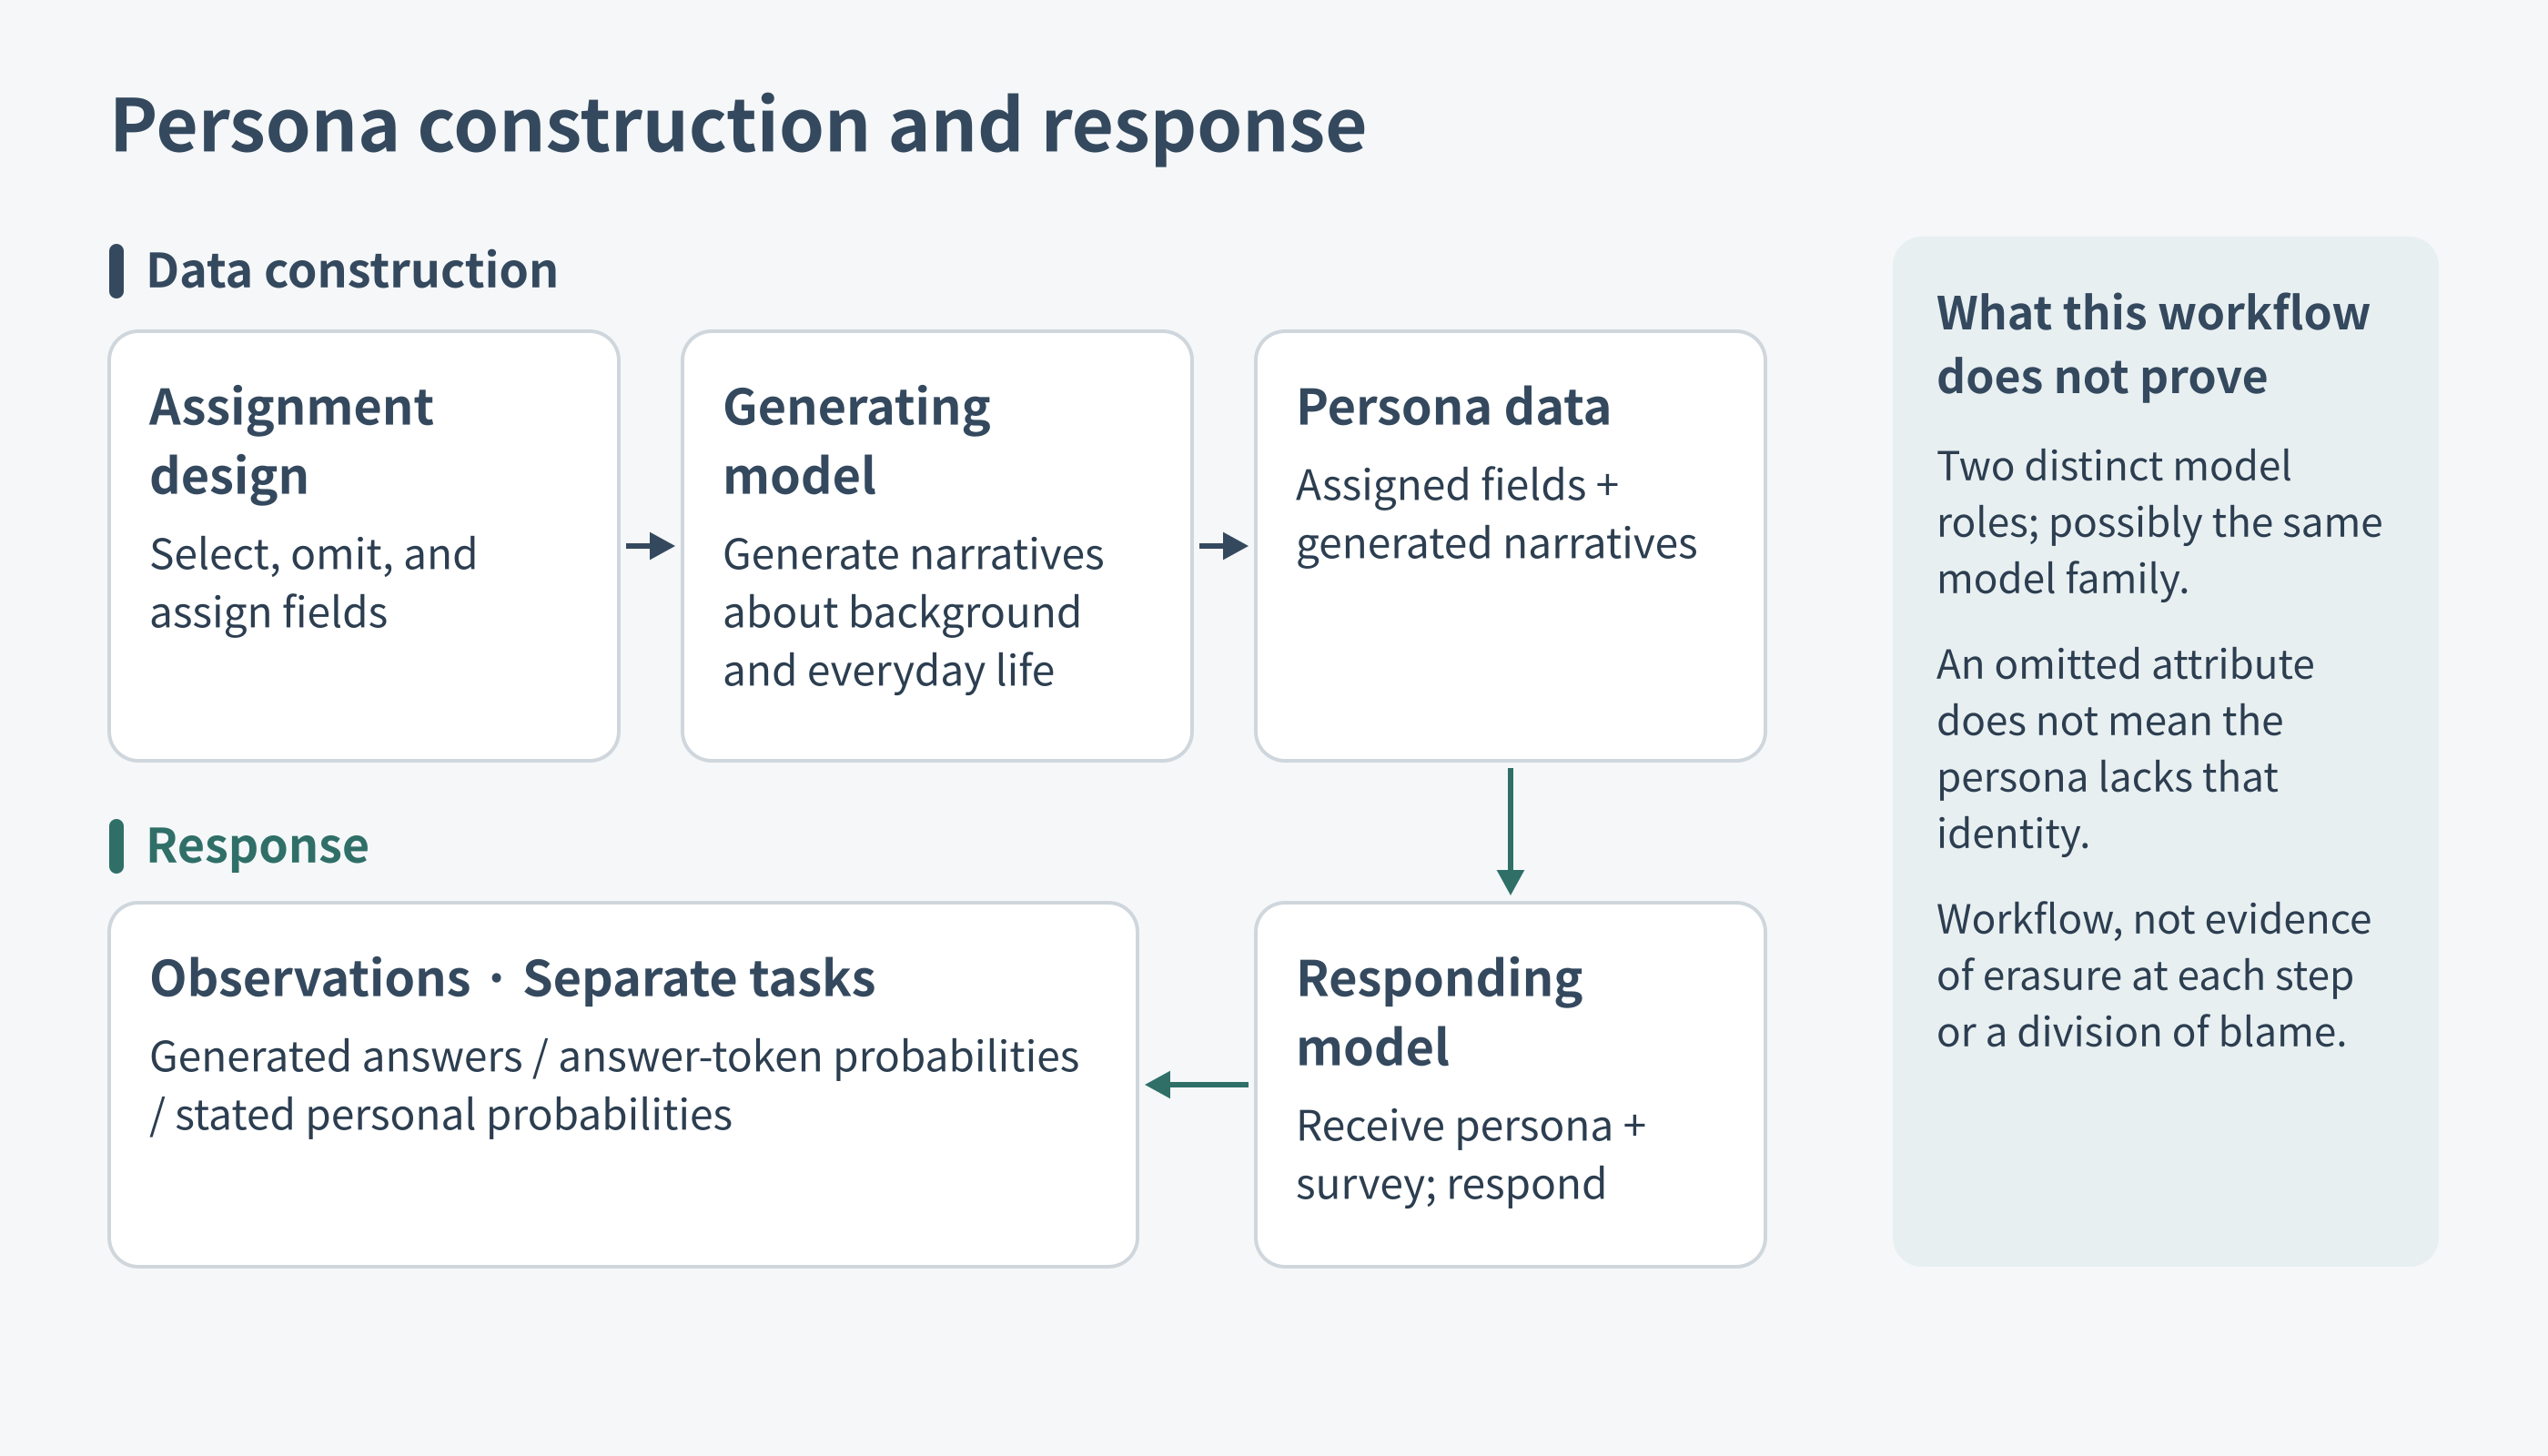
Figure 17. The workflow from persona construction to survey responses. The dataset is itself generated by models. Generation and response are distinct roles, but the models performing them may belong to the same family. This explanatory diagram does not demonstrate stage-by-stage erasure or apportion responsibility between data and models.
The “model side” asks whether, given this information, a model selects only a typical character from the range of possible people, or reduces minority possibilities when producing a role response. The observed gaps between conditions do not directly establish those mechanisms. Stating a population proportion is one generation task; estimating personal attributes or answering as one person is another. The relationships among training-data frequency, role performance, format, safety-related behavior, and reasoning paths still need to be disentangled.
A decrease without personas therefore does not exonerate NPK's composition. Conversely, a further decrease after adding personas in some models does not make the data responsible for every gap. Comparing persona populations with an attribute absent versus populations in which it is explicitly distributed, while also varying the response path, would make both questions more precise.
Follow-up questions
The next experiments, for which there are no results yet, address three questions:
- Composition and response path: How does the gap change when populations lacking the target attribute and populations with that attribute distributed explicitly are crossed with different response paths?
- Internal mechanisms: After checking the API observations under GPU conditions for open-weight models, can interventions on internal activations explain changes in minority responses?
- Outcomes not injected into the input: Does a population assigned an attribute reproduce not only that attribute but also distributions of health, daily life, and experiences that were not separately supplied?
If a prompt says “This person has registered-disability status” and the model answers accordingly, that primarily confirms instruction-following. The more important test is whether the resulting population validly reproduces health, daily-life, and experience distributions that were not injected into it. Matching a target proportion does not establish that next step.
So far, the work has provided evidence for separating questions rather than identifying one universal cause. Zero generated responses, tiny answer-token probabilities, and age-related patterns retained in stated probabilities are different observations. Those differences may prove useful, but they do not invalidate the original study's critique. A population with matching proportions is not yet a population that reproduces people's lives.
Denominators, missingness, and reproducibility
The inference unit is usually a persona, not a call. Repeated measurements without a persona estimate variability under that prompt; multiple models answering as the same persona do not create independent people. This table collects the sample and resampling rules used in the results above.
| Analysis | Base sample and retained denominator | Repetition or resampling | Seed |
|---|---|---|---|
| Common-input E1/E2/E4/BASE | E1: seven models × 1,000 plus Gemini × 200; other paths retain their valid records | E1 counts generated answers; E2/E4 average probabilities; BASE averages repeated statements | No single common bootstrap specified here |
| A, including P0/P2 | C2: 1,000 × three models × seven items; E2c: 1,000 × three × two primary items; paired contrasts retain valid shared personas | Persona-free repeats as in Result 2; 2,000 bootstrap draws; GLM remeasurement uncertainty included | 20261022 |
| MT | Nine × 200 primary conversations; reverse order three × 100; item-specific valid and applicable denominators | 2,000 paired bootstrap draws; exact McNemar for generated-answer contrasts | 20261022 |
| B1 | 200 × three × two items per condition; valid pair intersection, plus four-condition common-set sensitivity | 2,000 paired draws; fewer than 50 pairs insufficient | 20261024 |
| P3 | 300 × three × eight condition-item cells; four-condition valid intersection | 2,000 paired draws; fewer than 50 insufficient; separate non-option-zero sensitivity | 20261023 |
| P1 | Up to 1,000 per model/path; qwen E2 221 and E4 701; judgment needs at least 500 | 5,000 permutations; 2,000 bootstrap draws with recalibration | 20261025 |
| P6-0 | 200 per model/item, plus five BASE repeats per model; main total 810 | 2,000 persona bootstrap draws; phenomenon gate needs E2 n ≥100 | 20261026 |
| Gemma A, 1,000-person condition | Two models × the fixed 1,000 personas and two primary items; five persona-free repeats; main total 10,070 | Original and extraction-corrected judgments and transport failures kept separately; all-assigned denominators | Bounds on unreturned top-k mass, not bootstrap confidence intervals |
The common runner for E1/MT/B1/P3 keeps the latest record for each job ID rather than counting retries as additional observations. It does not repeatedly retry parse failures until a valid answer appears. It permits one retry after a transient error and one token-cap doubling after truncation, capped at 16,000. In numeric-answer paths, parse_truncated may preserve a measurement as ok with was_truncated=True when parsing yields a value; the non-option and probability-validity checks still apply. Failures, refusals, and missing values are not automatically “no.” MT's continuation behavior and B1's length/position rules are the specific exceptions and distinctions described in Result 3. Those general retry and token-cap rules do not describe the Gemma A condition: only bare provider errors without a model response were resumed with separate raw and accounting records; truncations and parse failures were not resampled.
In A, persona-free repetitions are resampled, C2/E2c personas are resampled as pairs, and GLM repeated measurements are drawn within that uncertainty calculation. The reported stage-share statistic is (N_before - N_after) / (N_BASE1 - N_E2); it is withheld if the denominator interval includes zero. Its registered classification uses thresholds .5, .1, and -.1. Such shares describe contrasts among these prompts, not causal percentages of historical responsibility for model training or persona generation.
The source functions for the measurement path are exp2.system_message, item_text, and parse_dist; exp3.c2_system and parse_lp3; runner.load_latest; the MT user_message, first_json, and parse_answers path; the B1 condition builder; p3_system; and P1's logit, shift, distance, and analyze. The corresponding analysis files are analyze_a.py, analyze_mt.py, analyze_b1.py, analyze_p3.py, and analyze_p1.py; Gemma's measurement configuration is in p6_0.py. These filenames identify the implementation inspected, not public download links.
The quoted raw-response excerpts and settings were checked against saved records and static code. The scalar C1 calculation and P1 aggregate-distance inputs are provided so that readers can inspect those computations without rerunning an API experiment. The complete individual data and analysis code are not public, and the serving behavior described here is not recoverable from this article. Consequently, these examples do not make all aggregate results fully independently reproducible, and they do not reveal latent beliefs.
Gemma A conditions: serving settings, token bounds, and JSON extraction
The Gemma model identifiers are google/gemma-3-27b-it and google/gemma-4-31b-it through a fixed Parasail route with fallback disabled. The request and endpoint listing specified fp8. The request and listing document the serving path; they do not independently verify the precision of the remote weights. No GPU bf16 run or activation intervention was performed for these conditions.
Both models used temperature 0, top_p:1, a one-token numeric-answer cap, and top-20 logprobs. Statement calls used a cap of 500. Each persona-free condition had five repetitions; C2, E2c, and E4 each used the same fixed 1,000-person set. Gemma 4 requests disabled reasoning; Gemma 3 requests omitted the reasoning field. The five-question BASE and E4 bundles were also collected, but BASE is not used as a replacement for BASE1 in Figure 9.
The deepseek token measurements used temperature 1, while Gemma used temperature 0. Output caps and repetition counts also differ across configurations, as specified in Result 2. P0, P2, and the multi-turn experiment have their own model sets and settings and are not assumed to share this Gemma A protocol.
For the Gemma A numeric-answer measurements, the first non-whitespace generated token must be a valid option. The parser checks response-text/token alignment, finite logprobs above the sentinel, chosen/candidate consistency, token representations, and candidate-mass consistency. It does not search later in the answer for an option digit. Empty displays for non-chosen candidates can be retained as unidentified mass without guessing that they are an end token or a numeric option. None occurred in the Gemma A main sample. Their occurrence in instrument checks was a token-display issue, not an empty answer text.
Let M be the returned minority-option mass, O the total returned numeric-option mass, and R the remaining unidentified mass outside the known candidates. The legacy point is M/O. For a valid observation with both minority and non-minority options, conservative bounds are:
The lower end assigns the remaining mass to non-minority options; the upper end assigns it to minority options. These bounds retain the uncertainty left by the top-k response without estimating a sampling distribution. When records are invalid or missing, the assigned-record analysis retains their full [0, 1] range rather than replacing them with zero. The displayed ranges average these bounds and scale them to 1,000. Figure 9a shows why a point near zero and its upper bound must be reported separately.
The statement analysis also required an explicitly post-observation implementation correction. Three Gemma 3 C1v registered-disability replies contained a standalone period before a fenced JSON body. The original wrapper whitelist rejected that prefix even though the JSON was present. Existing A extraction takes the exact raw substring from the first opening brace to the last closing brace. Applying that same extraction span, followed by the stricter duplicate-key, numeric-type, item/option, range, sum, refusal, and truncation checks, changed this cell from 2/5 valid to 5/5 valid. Its valid-only point remained 50 per 1,000. No statement percentages were renormalized, numeric strings and booleans were not accepted as numbers, and multiple JSON objects were not resolved by choosing whichever one parsed.
The corrected analysis is therefore an observed-data implementation correction, not a previously unobserved confirmatory analysis. Original judgments were retained separately. All 10,070 main records were valid under the corrected analysis. The extraction span now matches older A. The remaining checks stay stricter than those in the older parser.
Provider-specific controls also limit how the returned LP scores should be read. For Gemma 3, strong opposing option biases changed the selected answer between 2 and 1 while the returned option LPs stayed equal to the unbiased control: logp(1)=-0.0024304632 and logp(2)=-8.252430916. That behavior is consistent with returned scores preceding the applied bias. Raw middle-range scores were not observed for Gemma 3 in the pilot. Gemma 4's returned scores changed under bias, and its controlled ranges entered the middle band. These are API observations about the two serving paths, not identification of internal server functions. The main tasks used no logit bias. Neither control establishes external probability calibration or equivalence to observed sampling frequencies.
The Gemma A collection contains 10,070 main responses and 194 pilot/diagnostic responses over 10,301 HTTP attempts. The additional failed attempts were 36 HTTP 429 responses and one HTTP 502 response. Their zero model-token charges followed OpenRouter's failure-pricing policy[1]; they were not observations of usage.cost=0 in those error replies and were not additional behavioral responses. The total recorded cost was 1.09445230 for main and $0.01220045 for pilot/diagnostics. These are the costs recorded for this collection, not a forecast for a repeat run. Individual logs and code remain non-public, so the article's tables and method descriptions do not supply a public raw-data replication package.
Data availability and methodological notes
- Measurement schedule. The initial independent checks cover observations through October 23, 2026. The deepseek/GLM/Mistral primary A measurements are dated October 22; E2c and B1 were collected on October 22 and October 23, respectively. The Gemma A collection is dated October 28. These dates describe separate protocol collections, not a rerun of every experiment. The P6-0 and 1,000-person A settings and samples are kept separate.
- Dates and model scope. This post combines the initial exploration, the common-input experiments on October 20–21, 2026, follow-up results from October 22–23, and the Gemma A condition. Model names in the text are shorthand for fixed model and provider configurations recorded at the time. They are not assessments of the latest models or entire model families. Versions and serving paths differ across the exploration, generated-response, and token-score protocols, so their results are not pooled as if they shared identical conditions.
- Model identifiers in the main comparisons. In the common-input and follow-up comparisons, deepseek refers to
deepseek/deepseek-v4.1-flash(DeepSeek), glm toz-ai/glm-5.3(Morph), mistral tomistralai/mistral-large-4-0(Mistral), and qwen toqwen/qwen3.8-flash(Alibaba), as recorded for those runs. Gemini's common-input and cumulative-conversation experiments used the Vertex path and Gemini Developer Batch API, respectively, so the serving paths also differed. - Sampling and reasoning. Temperature 0 was used where supported, but not for every model. Some runs used default sampling, and some models did not allow reasoning to be disabled. deepseek's answer-token probabilities use temperature-1 remeasurements because of the instrumentation issue. These are additional reasons not to interpret format comparisons as pure effects of internal reasoning.
- Departure from the registered rules. In the cumulative-conversation experiment, 49 qwen dialogues were resumed after stopping, contrary to the registered stopping rule. The decision to use resumed data in the primary analysis was adopted after examining results. A sensitivity analysis excluding 391 records after the stopping point did not change the main judgments, but that does not erase the departure from the prespecified rule.
- Scope of recalculation. Each follow-up report contains records of independent recalculation from raw data and checks of the accompanying claims. Preparing this post involved reviewing those reports and the necessary evidence, not rerunning the entire study or freshly recalculating all raw data. For successful MT/B1 records, the stored data retain the extracted answer-position top-k lists, but not the complete token-by-token logprob sequence; parse failures are an exception where full logprobs were retained. The saved top-k lists can be renormalized and checked against saved probabilities. The original choice and alignment of the answer position cannot generally be revalidated without the missing full sequence. Those are different levels of verification.
- Public availability. The independent experiments' raw data and analysis code are not yet public, so readers cannot independently recalculate their results. The links below are public sources for the original study, dataset, and external comparison statistics. They do not substitute for a repository through which the experimental numbers in this post can be directly verified.
Public sources
[1] NVIDIA, Nemotron-Personas-Korea[2]. Synthetic persona dataset. ↩︎ ↩︎2 ↩︎3
[2] Soomin Kim and Eun-Ji Paeng (co-first authors), Seung-Sup Kim (corresponding author), Department of Environmental Health Sciences, Graduate School of Public Health, Seoul National University. Study introduction and public presentation for Architect of Silence[3]. The full English title is Architect of Silence: Persona-prompted Large Language Models Make Minority Population and Social Suffering Invisible. The presentation pages used here are p. 2 for authorship, pp. 4–6 for background, pp. 7–13 for methods, pp. 15–34 for results, and pp. 35–40 for interpretation. ↩︎ ↩︎2 ↩︎3 ↩︎4 ↩︎5 ↩︎6 ↩︎7 ↩︎8
[3] The original study's public repository, architect-of-silence-llm[4]. Source of the public persona list, system message, and other materials used for reconstruction. ↩︎
[4] Ipsos, LGBT+ Pride 2023 Global Survey Report[5], sexual-orientation tables and methodology. Used to distinguish the combined gay/lesbian and bisexual categories from the broader category including pansexual and asexual identities, and to establish the scope of the South Korean online sample. ↩︎
[5] KOSIS, Ministry of Health and Welfare, Disability Statistics, Registered persons with disabilities by sex and age[6]. The age-pattern analysis used year-end 2025 data. ↩︎
[6] Ministry of the Interior and Safety, Resident Registration Population Statistics: Population by Age[7]. The denominator for the age-pattern analysis is dated December 31, 2025. ↩︎
References · 7
- [1] OpenRouter's failure-pricing policy — openrouter.ai
- [2] Nemotron-Personas-Korea — huggingface.co
- [3] Study introduction and public presentation for Architect of Silence — oeh.snu.ac.kr
- [4] architect-of-silence-llm — github.com
- [5] LGBT+ Pride 2023 Global Survey Report — ipsos.com
- [6] Registered persons with disabilities by sex and age — kosis.kr
- [7] Resident Registration Population Statistics: Population by Age — jumin.mois.go.kr