The Bottleneck Came After the GPU
Tracing the time CREATE INDEX spends after the GPU has built the graph. On a diagnostic build of GPU-built HNSW, about 49 of 82 seconds went to moving the graph into PostgreSQL pages; in CAGRA, CREATE INDEX took about 15 seconds more than a direct build. This post follows both causes and how much each was reduced (for CAGRA, only in an experimental build so far), with the measurement conditions attached.
In the previous post, which presented a written version of my PGConf.Asia 2026 talk on pg_cuvs, we devoted two paragraphs to the cost of going through PostgreSQL. This post takes a closer look at the index build side of that cost. We examine two pg_cuvs indexes whose graphs are built on the GPU: an HNSW index (pg_cuvs_hnsw), which the GPU builds and pgvector serves on the CPU, and a CAGRA index, which the GPU both builds and searches. In both cases, CREATE INDEX still took a long time to finish after the GPU had built the graph. We identified the causes by breaking that remaining time into segments.
We begin with the results and their conditions.
- HNSW: For over 999,000 vectors of 768 dimensions,
CREATE INDEXtook about 82 s on a diagnostic build (one run), with about 49 s spent moving the GPU-built graph into PostgreSQL index pages. The cause was a table of about 8 MB being read repeatedly, tens of millions of times, through a 32 KB cache. Four changes that reduced the time spent on that step and the surrounding segments, including the fix for those repeated reads (#210[1], #213[2], #214[3], #215[4]), were released in 0.9.1. With all four changes in place,CREATE INDEXtook about 25.6 s (build_algo = 'ivf_pq',ef_construction = 128, median of three runs with a patched cuVS 26.04 held fixed). The 82 s and 25.6 s measurements do not come from the same experiment. - CAGRA: Building an index over one million 768-dimensional vectors on one GPU server (
graph_degree64, intermediate 64, medians of three runs) took about 12.1 s when calling cuVS directly, compared with about 27.2 s throughCREATE INDEXon pg_cuvs v0.9.2. Going through PostgreSQL added about 15 s, or about 124% of the direct build time. When we broke down those 15 seconds on another server of the same type with the default settings, most of the time was spent by the daemon saving the index files after the GPU build. More than half of that save time went to a checksum computed on one thread. An experimental build with a faster save path took about 16.6 s at the same setting, reducing the added time to about 4.4 s (about 37%). That experimental build has not been merged and is not in a release.
All of these measurements are our own and have not been reproduced independently.
What CREATE INDEX does for the two indexes
pg_cuvs consists of two parts: an extension loaded into every PostgreSQL backend and a single daemon process (pg_cuvs_server) that owns the GPU. For both indexes, the backend reads the table and passes it to the daemon, which builds the graph on the GPU. What happens next differs.
In the default build of CREATE INDEX ... USING pg_cuvs_hnsw, the daemon writes the GPU-built graph to a temporary hnswlib-format file. The backend then reads that file and writes its contents into the PostgreSQL index using pgvector's HNSW page format (ARCHITECTURE.md, section 3.1b[5]). This final step is the import. Because pgvector serves the imported index, searches do not need the daemon.
With CREATE INDEX ... USING cagra, the daemon saves the index to files itself. It writes the index files under temporary names, syncs them to disk (fsync), renames them, and only then replies. If CREATE INDEX returns successfully, the files are on disk. That is the command's guarantee, which is not included in the timing of a direct cuVS call.
HNSW: 49 of 82 seconds in the import
For over 999,000 vectors of 768 dimensions, CREATE INDEX took about 82 s on a diagnostic build (one run), with about 49 s spent on the import. For each node, the import looked up its location in the index using a table, reading that table through a four-page (32 KB) cache. Replaying the access order yielded 64,935,002 lookups, of which 56,497,735 (87%) missed the cache. That amounted to about 462 GB worth of 8 KB read requests against a table of about 8 MB.
Because the locations follow a regular layout, the fix computes them instead of reading them (#210[1]). The import time fell from 48.57 s to 11.25 s, while CREATE INDEX time fell from 81.67 s to 44.27 s (one run each on a diagnostic build, the same WAL bytes). Graphs with hierarchy cannot use the computed path and therefore gain nothing.
HNSW: three more changes
The next changes began with a baseline whose time was broken into segments. Across three runs, the median CREATE INDEX time was 33.150 s, broken down as follows (#213[2]):
| Segment | Time |
|---|---|
| Reading the table, writing the file handed to the daemon, and preflight checks | 8.967 s |
| Daemon job (includes the GPU graph build) | 9.941 s |
| Import after the daemon reply | 14.105 s |
The import time here (14.105 s) and the import time after #210 (11.25 s) were measured over different spans on different builds, so we do not compare them directly. In a build where the daemon job took about 10 s, the backend segments before and after it took about 23 s. The next three changes all reduced the time spent in those backend segments.
- The index previously grew one block at a time; it now grows by up to 32 pages at a time (#213[2]).
CREATE INDEXtime fell from 33.150 s to 30.004 s, and import time fell from 14.105 s to 11.130 s. - The input hash was previously computed row by row while reading the table; it is now computed while waiting for the daemon's reply (#214[3]).
CREATE INDEXtime fell from 30.145 s to 28.145 s, and the segment before the daemon fell from 8.982 s to 6.882 s. - The backend previously read the daemon's file one field at a time; it now reads through 1 MiB windows (#215[4]). Backend read calls fell from 9,991,134 to 7,537.
CREATE INDEXtime fell from 30.145 s to 27.739 s with this change alone, and to 25.608 s when combined with #214.
All measurements are medians of three runs. In the #213 and #214 measurements, the daemon job stayed at 9.9 to 10.0 s. All four changes are included in 0.9.1.
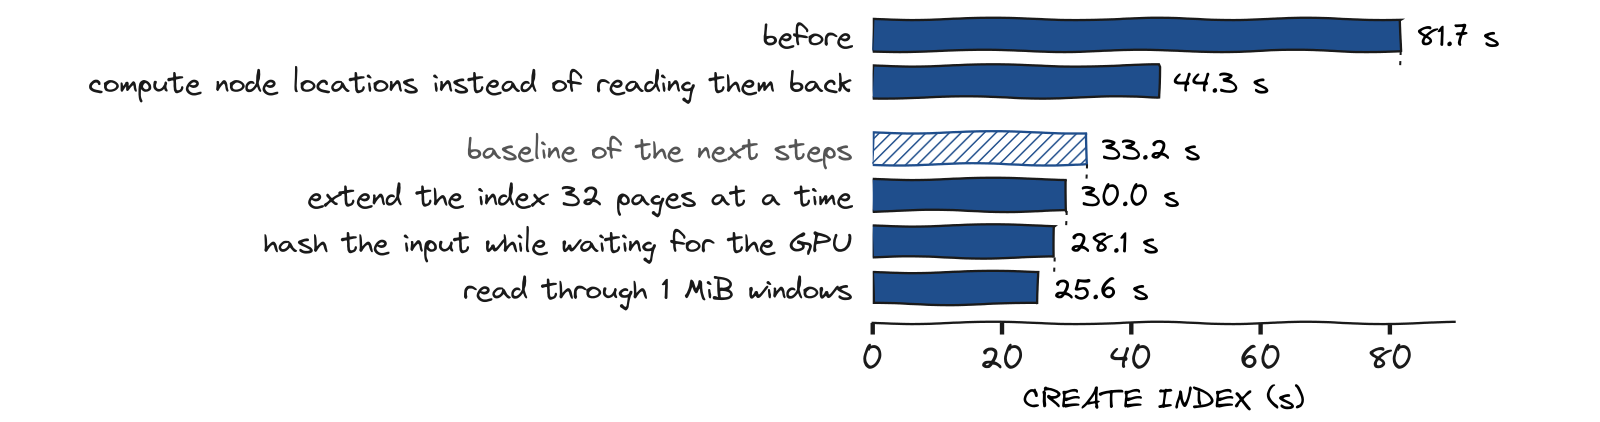
Figure 1. CREATE INDEX ... USING pg_cuvs_hnsw time after each change. 999,000 x 768, one A100-SXM4-80GB VM, build_algo = 'ivf_pq', ef_construction = 128. The first two bars are single runs on a diagnostic build; the others are medians of three runs. The medians were measured with a patched cuVS 26.04 held fixed, so the absolute times hold only for that SDK and only the differences between changes come from pg_cuvs code (0.9.1 changelog, PRs #213 to #215). The figure is from the talk slides.
The 82 s and 25.6 s measurements, however, do not come from the same experiment. The first two bars represent single runs on a diagnostic build, and the changelog does not explain the gap between 44.27 s and the next baseline of 33.15 s. #214 and #215 were measured against 30.145 s, a fresh measurement of the same code, rather than against #213's 30.004 s. We therefore do not claim that "four changes turned 82 seconds into 25.6". Instead, we report the two endpoints and the difference measured for each change. There is no record of how much of the 82 seconds was GPU time. The measurement conditions and trade-offs of each change are documented in the 0.9.1 changelog[6] and the PRs.
CAGRA: 15 seconds more than a direct build
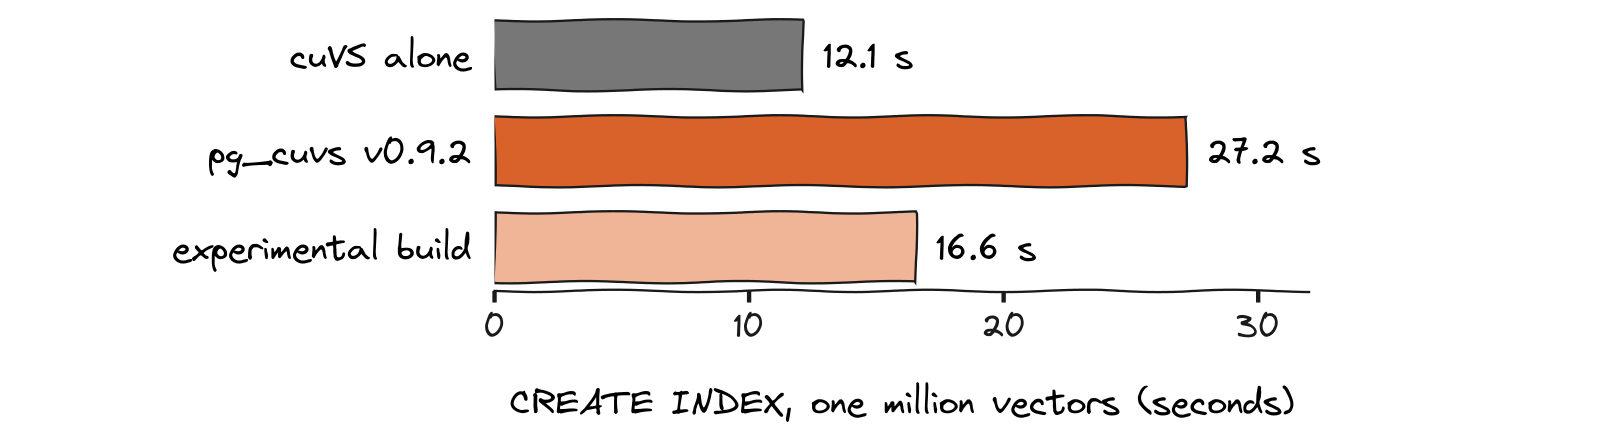
Figure 2. One million x 768, CAGRA graph_degree 64 and intermediate 64, medians of three runs on the same GPU server (A100-SXM4-80GB). The experimental build is not in a release. The figure is from the talk slides.
The three values in Figure 2 were measured on the same server on the same day. Several distinctions matter when interpreting the difference:
- The direct build time is the library build time measured by cuVS's benchmark tool, whereas the pg_cuvs measurement covers the entire
CREATE INDEXcommand as measured by psql. They do not cover the same span. The 15 seconds represents the time added by going through PostgreSQL, not the duration of any single step. - The two were measured on the same server and day, but not at the same time. The daemon was running during the pg_cuvs runs but not during the direct builds.
- The GPU build time logged by the daemon is 1 to 1.6 s shorter than the direct build time, and we did not check whether the two cover exactly the same span. Therefore, subtracting the daemon's GPU build time from
CREATE INDEXtime should not be interpreted as the time added over the direct build.
The added time varied little across settings. In a separate comparison, we built nine settings once each, both directly and through PostgreSQL. Every one of the nine builds took 14.96 to 15.86 s longer through PostgreSQL (single runs; the two sides used different libcuvs builds). Across these settings, the added time remained at about 15 s.
CAGRA: where the 15 seconds went
We broke down those 15 seconds on another A100 server of the same type, using the default settings (graph_degree 64, intermediate 128) (#233[7]). Both the server and the setting differ from Figure 2, so the two are not one experiment. On that server, CREATE INDEX took 27.53 to 27.83 s (five runs), consisting of 12.00 to 12.23 s of GPU build time and 15.01 to 15.21 s of saving after the build. A separate breakdown on a server of the same type put the time spent reading the table and handing it to the daemon at about 0.2 s.
A single daemon thread handles the entire save, processing each task sequentially. With only logging added, three runs yielded the following breakdown:
| Work in the save step | Time |
|---|---|
CRC32 over the body of the vector file (.vectors) | 8.27 s |
Writing .vectors | 1.58 s |
fsync of .vectors | 0.73 to 0.81 s |
Serializing the CAGRA index (.cagra, which includes the vectors again) | 3.45 to 3.47 s |
fsync of .cagra | 0.73 to 0.86 s |
| The rest (row address file, renames, registration) | about 0.12 s |
More than half of the save time was spent computing a checksum byte by byte over about 3 GB of vectors (one million x 768 x 4 bytes). During the save, that thread was the only one in the daemon using the CPU; the other 23 vCPUs were idle. Disk writes averaged 360 to 382 MB/s, below the limit measured by dd on the same disk (about 0.9 GB/s for buffered writes with fsync). The bottleneck was the single thread, not the disk.
Of this time, the two fsyncs (about 1.5 s together) account for the durability guarantee of CREATE INDEX described above. Most of the remaining time came from our own code.
The save step also had a cost beyond its duration. The daemon holds its global lock (g_index_mutex) throughout the save, so searches on other indexes in the same daemon stall for that duration. During two builds of one million vectors, a single query sent to a separate index took 15.21 s and 15.14 s. In a control window that only wrote 6.1 GB to the same disk, the worst latency was 14.6 ms. This remains open as issue #233.
CAGRA: an experimental build with a faster save path
Because the cause was in the save step, we created an experimental build with a faster save path and measured it on the same server. At the Figure 2 setting, CREATE INDEX took about 16.6 s, about 4.4 s more than the direct build (about 12.1 s). That added time was about 37% of the direct build time, compared with about 124% on v0.9.2. Across all nine settings, the experimental build was 9.9 to 10.8 s faster than v0.9.2, while single-query search performance remained within a few percent of the release.
These results require some caution. The experimental build has not been merged and is not in a release. Its changes have not been published, and we did not break down the time saved by individual change. The percentages above are calculated from the three published values for the one setting in Figure 2.
What the two cases have in common
For both indexes, the time was spent not on GPU work but on moving the GPU's results into PostgreSQL pages or files on disk. For HNSW, an 8 MB table was read tens of millions of times through a small cache; for CAGRA, one thread computed a checksum over 3 GB. We confirmed both causes only after timing the build in segments: for HNSW by replaying the import's access order, and for CAGRA by adding a log line to each task in the save.
The two cases are at different stages today. The four HNSW changes were released in 0.9.1, while the CAGRA save-path fix exists only in the experimental build.
What is left
- HNSW graphs with hierarchy cannot use #210's computed path. #213 was not tested on an assertion build or through crash recovery, and #214 involves a trade-off: if a spool reread fails after a successful daemon build, the GPU build time is lost.
- The experimental build with the faster CAGRA save path is not in a release, and the issue of searches stalling during the save (#233) remains open.
- Even the experimental build takes about 4.4 s longer than a direct build, and those 4.4 s have not yet been broken into segments.
- On the search side, the 0.25 to 0.32 ms per query added by the path through PostgreSQL and the daemon across 315 same-setting pairs has not yet been broken into segments.
All numbers come from our own measurements on one type of A100 with about one million 768-dimensional vectors. On a different GPU or with a different data size, the relative costs of the segments may differ. The HNSW import measurements are documented in the 0.9.1 changelog[6] and the PRs, while the CAGRA save-step measurements are in issue #233[7].
References · 7
- [1] #210 — github.com
- [2] #213 — github.com
- [3] #214 — github.com
- [4] #215 — github.com
- [5] ARCHITECTURE.md, section 3.1b — github.com
- [6] 0.9.1 changelog — github.com
- [7] #233 — github.com